I created this page to make it easy to keep up with local and other random COVID19 data. Although it is difficult to draw clear conclusions from these data, it is the best we have, and as scientists we try and do the best analysis we can given the circumstances. As usual we end up with more questions than answers. Among other things, testing rates, the location of tests, and the efficacy of tests can make the data misleading. I still believe we can respond better to the crisis with data than without.
The data all come from the John's Hopkins database1 on Github. This page is not very sophisticated. It is not live, and I update it manually a few times a day. I may make it more automatic in the future. The regions on the page at the moment are Worcester County, Suffolk County (Boston), Massachusetts, Florida, Georgia, and Illinois. I picked these regions because they were local, or examples of states with a surge, steady state, or a drop in cases to compare with our local data.
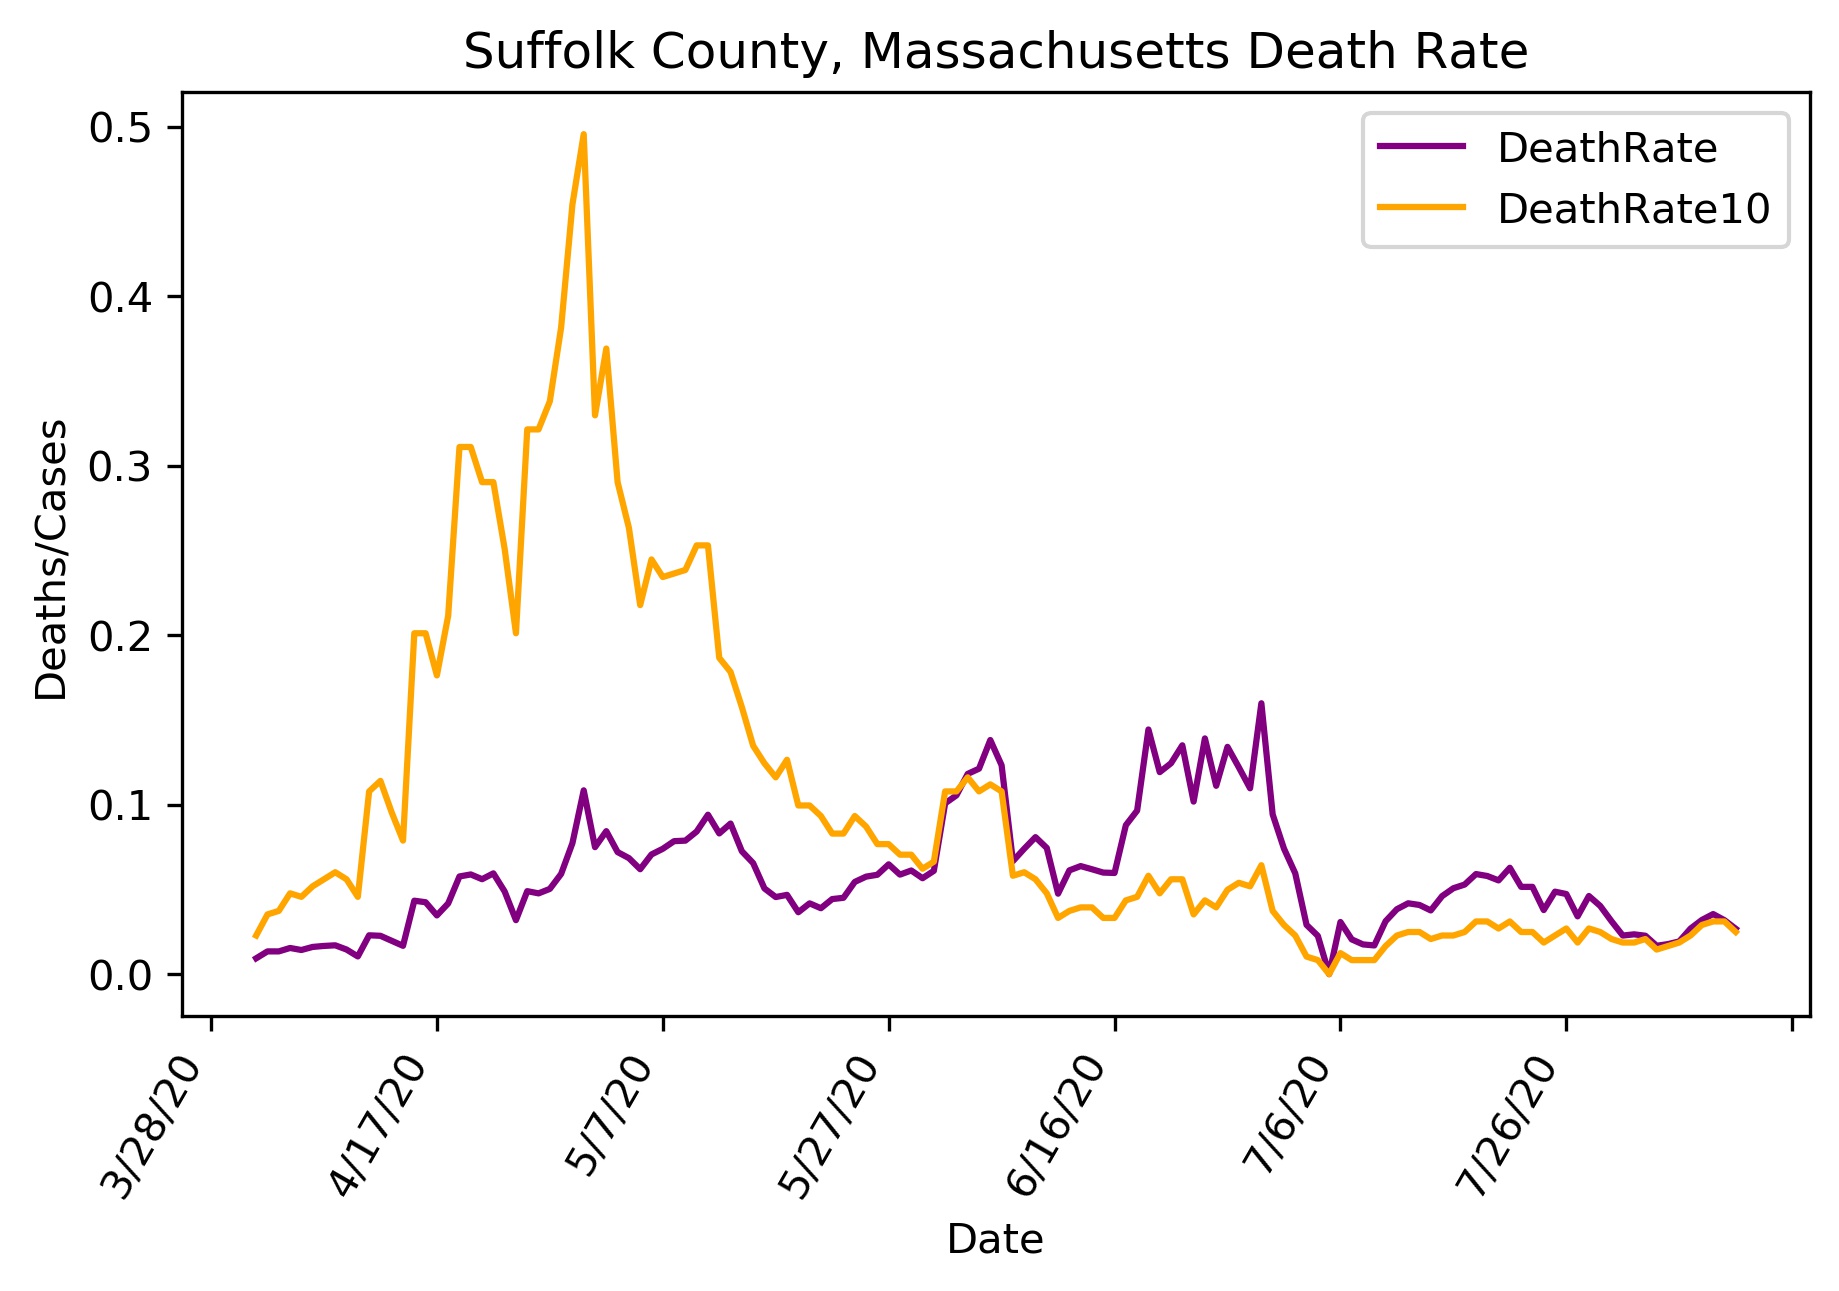
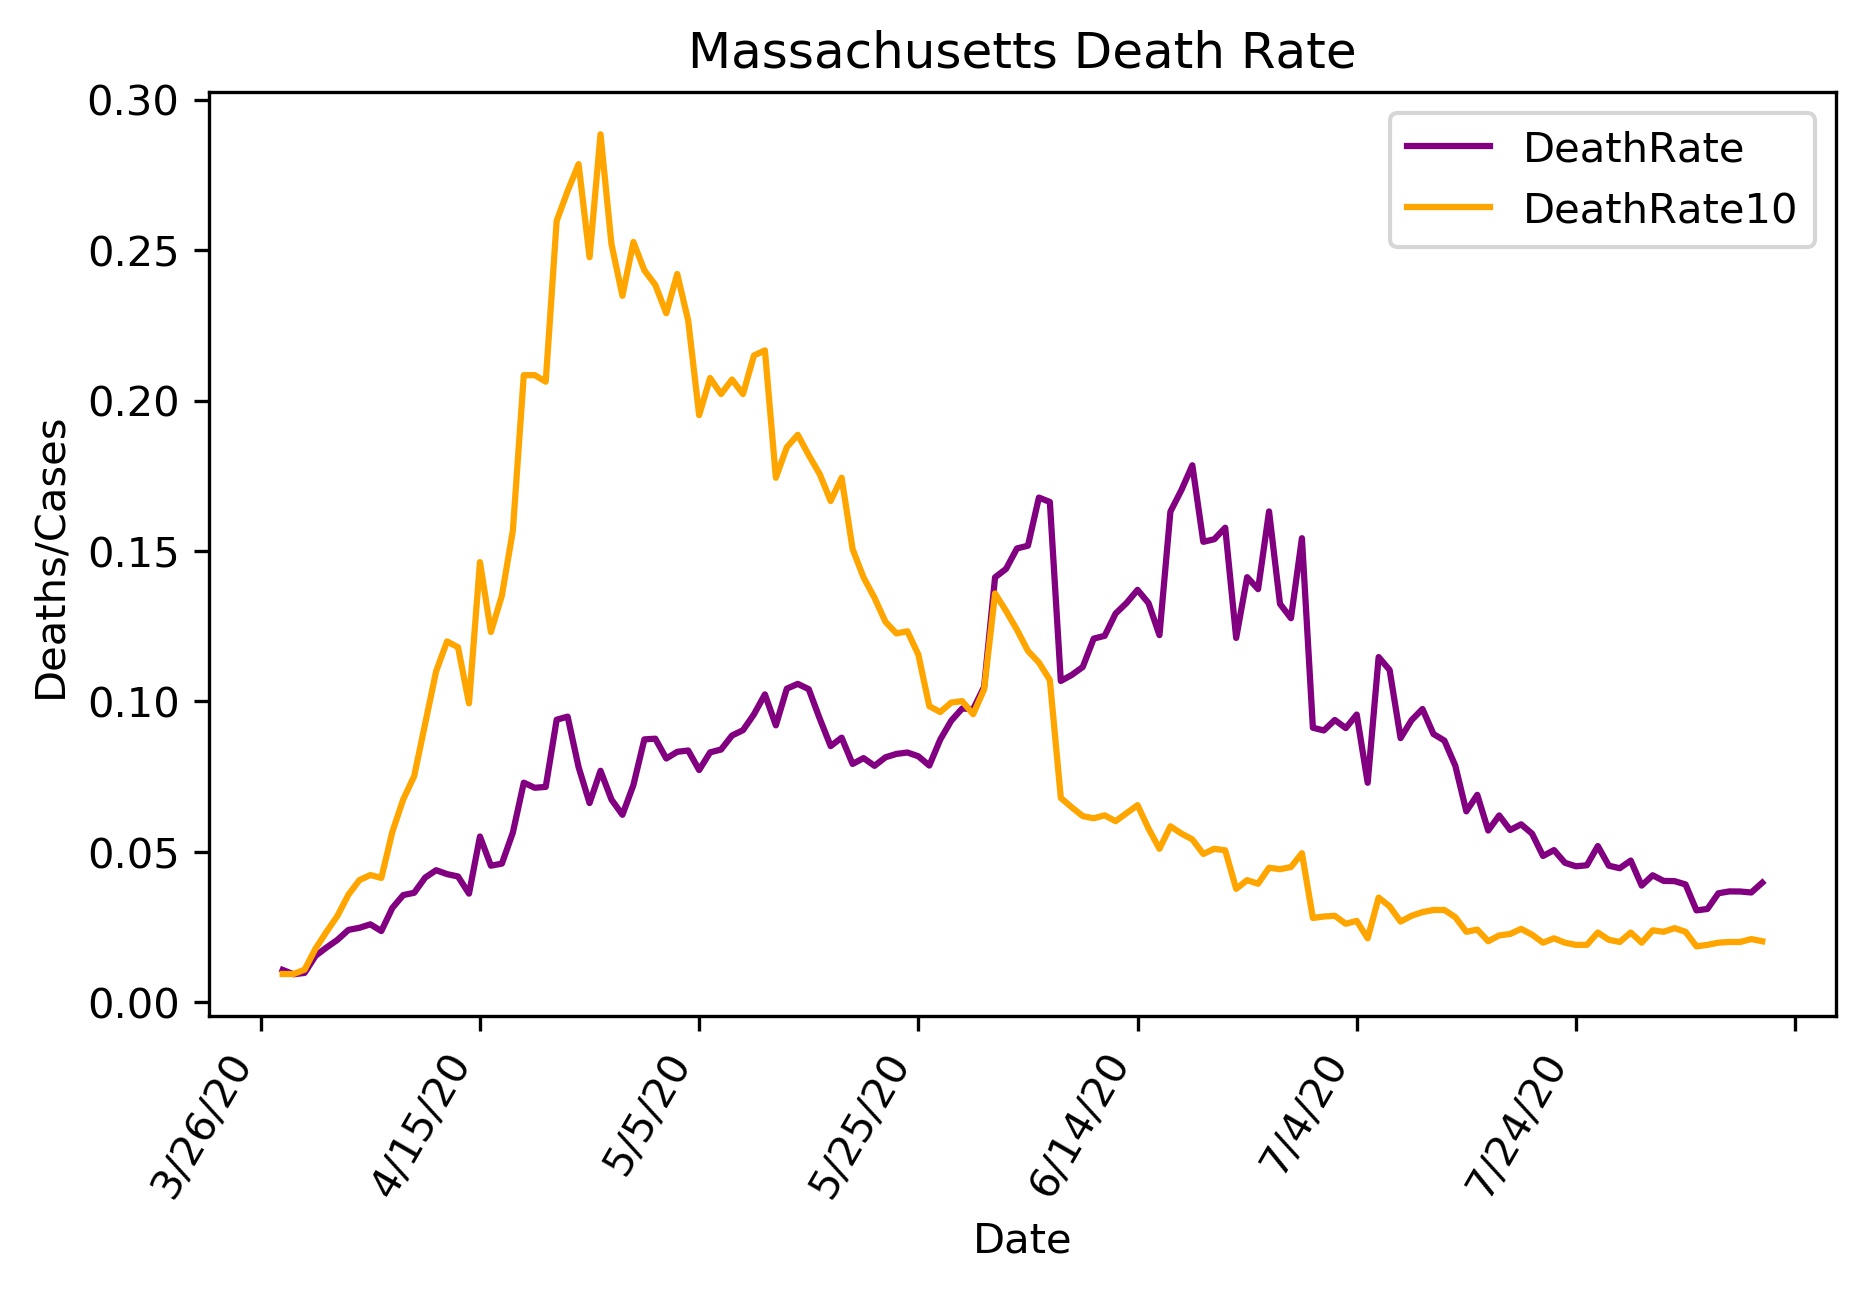
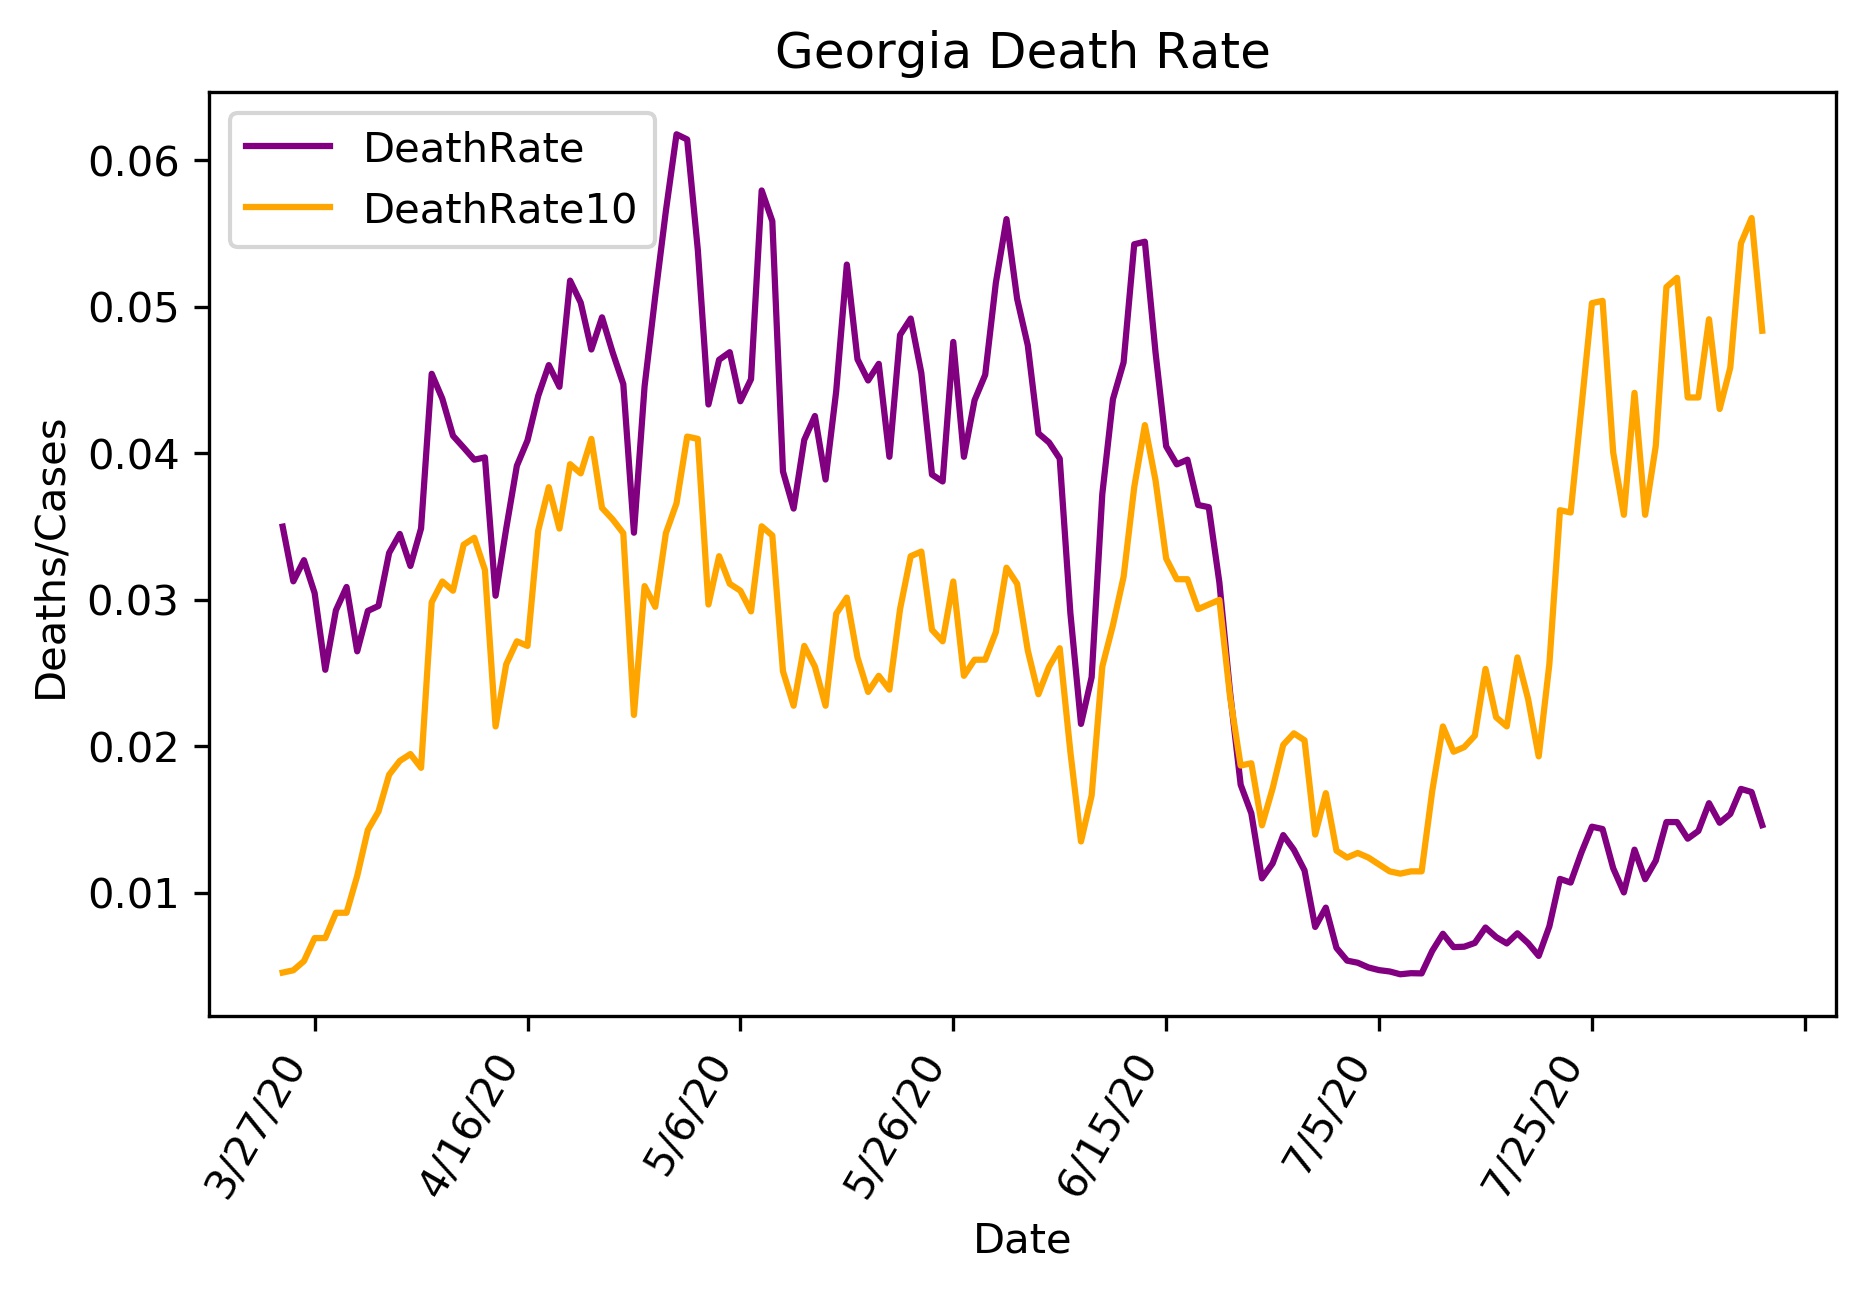
The page starts with Worcester data, a summary, and then larger figures of each of the other regions. The Case data and Deaths data are obvious. The Death Rate is calculated two ways. The first is deaths/cases, a common measure of how deadly the virus is. However, this measure is contingent on wide spread random testing. I also calculated the deaths/10,000 people. (I used 10,000 because it gives a value similar to deaths/cases, and I have yet to learn how to make two y-axes.) Deaths/population is a more absolute measurement of the infiltration of the virus into the community.
Feel free to send me comments by email.
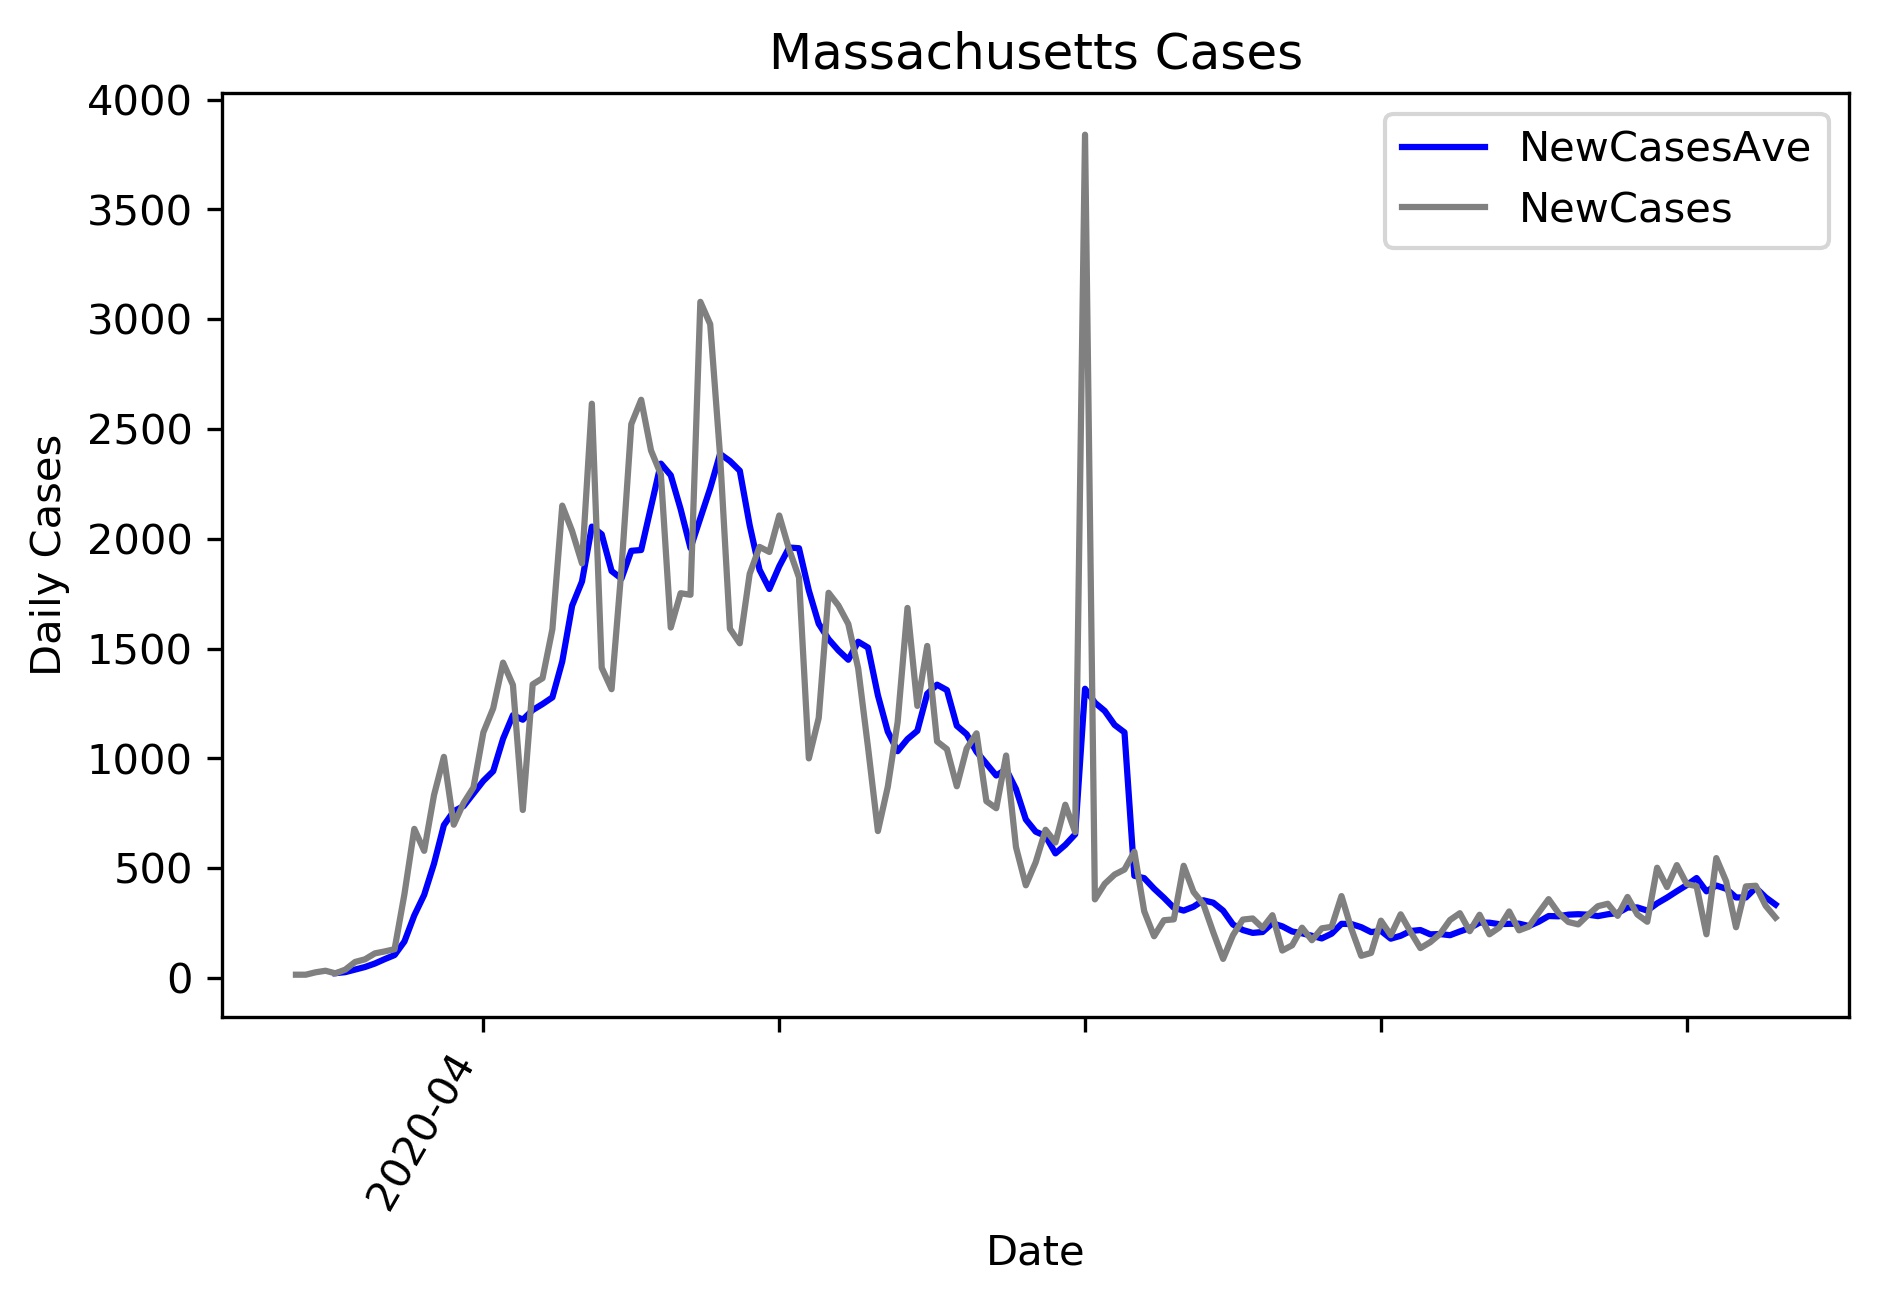
Mass Data
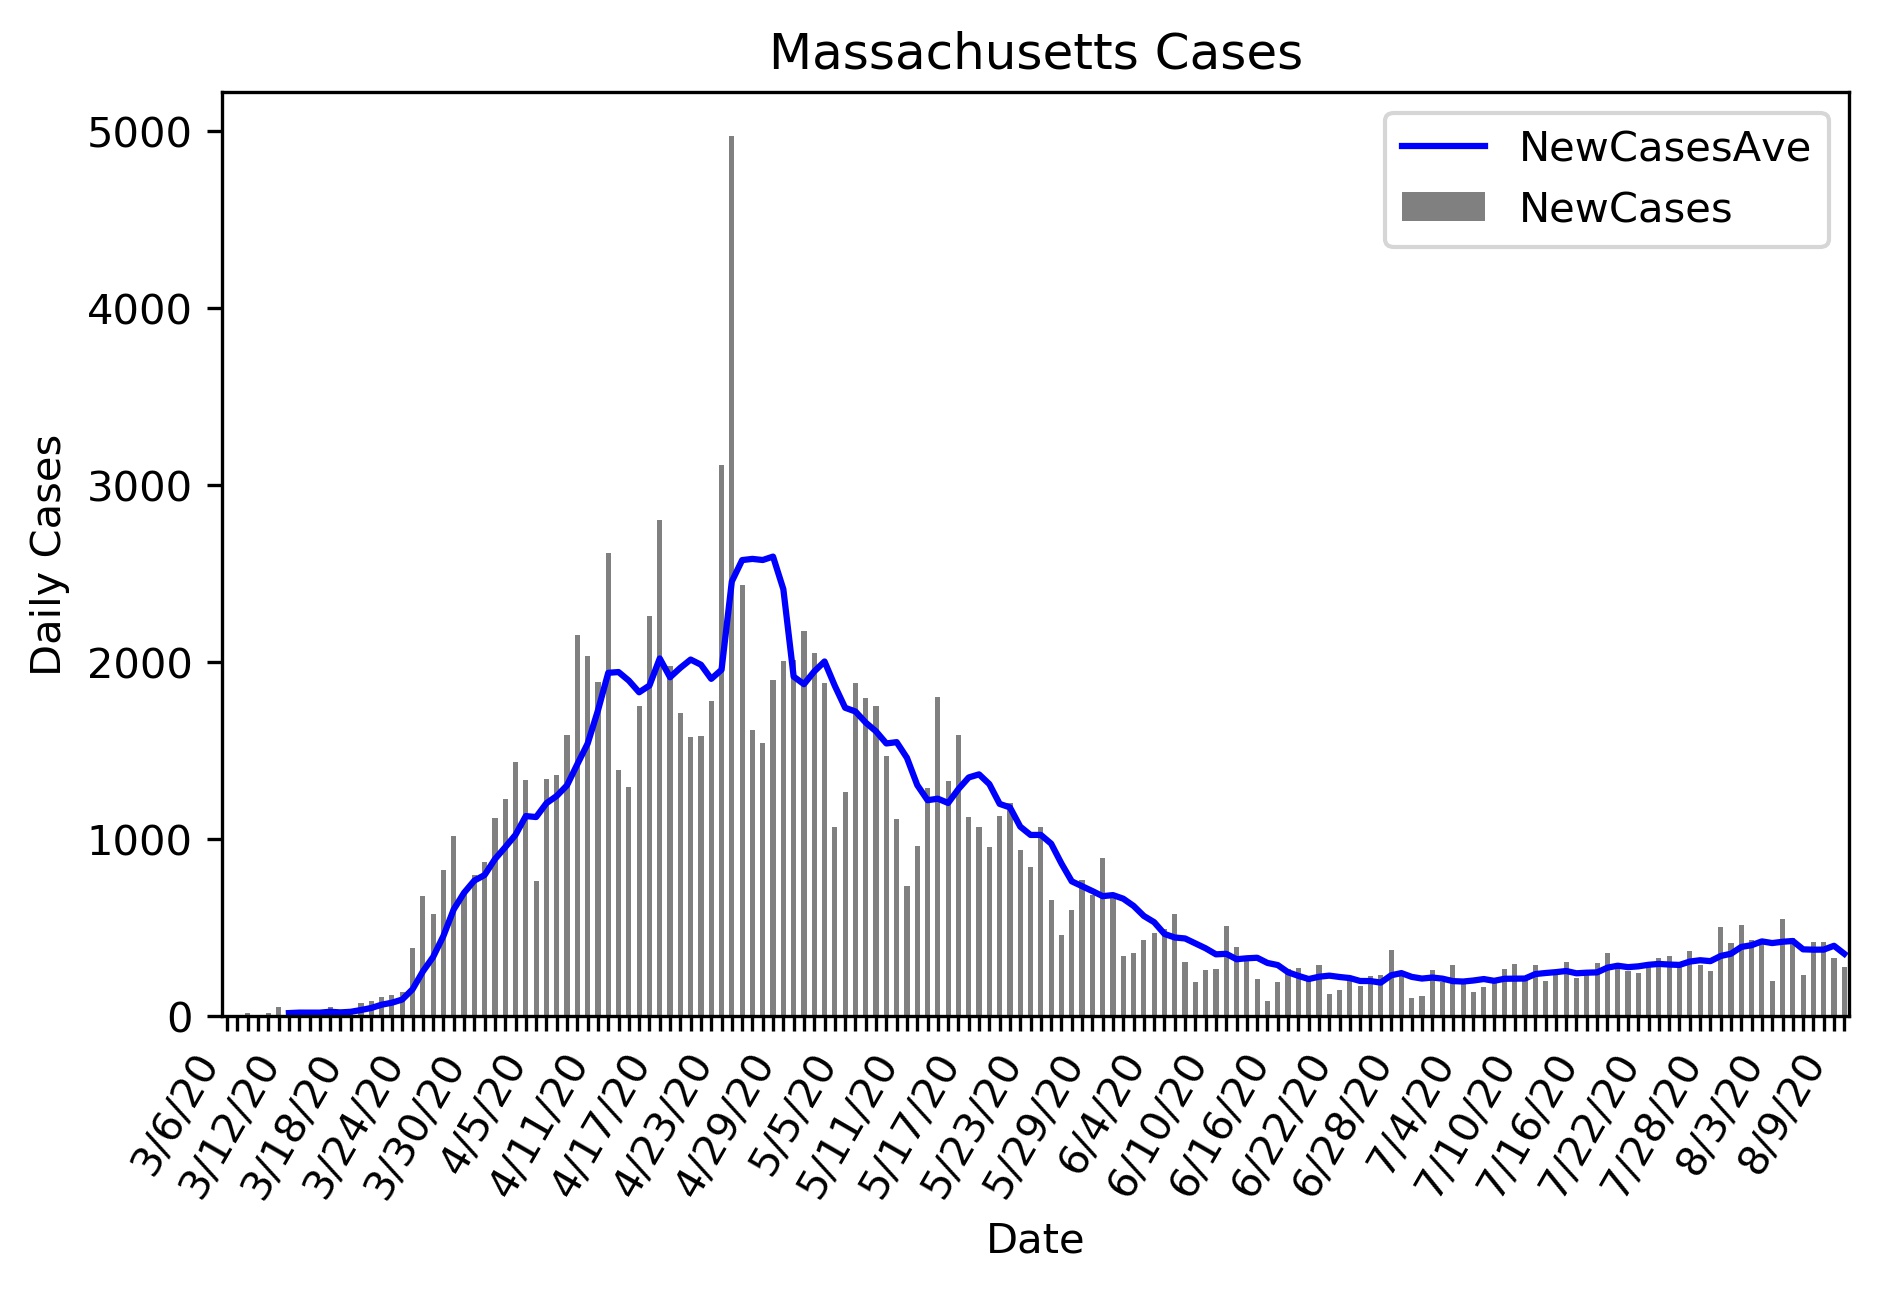
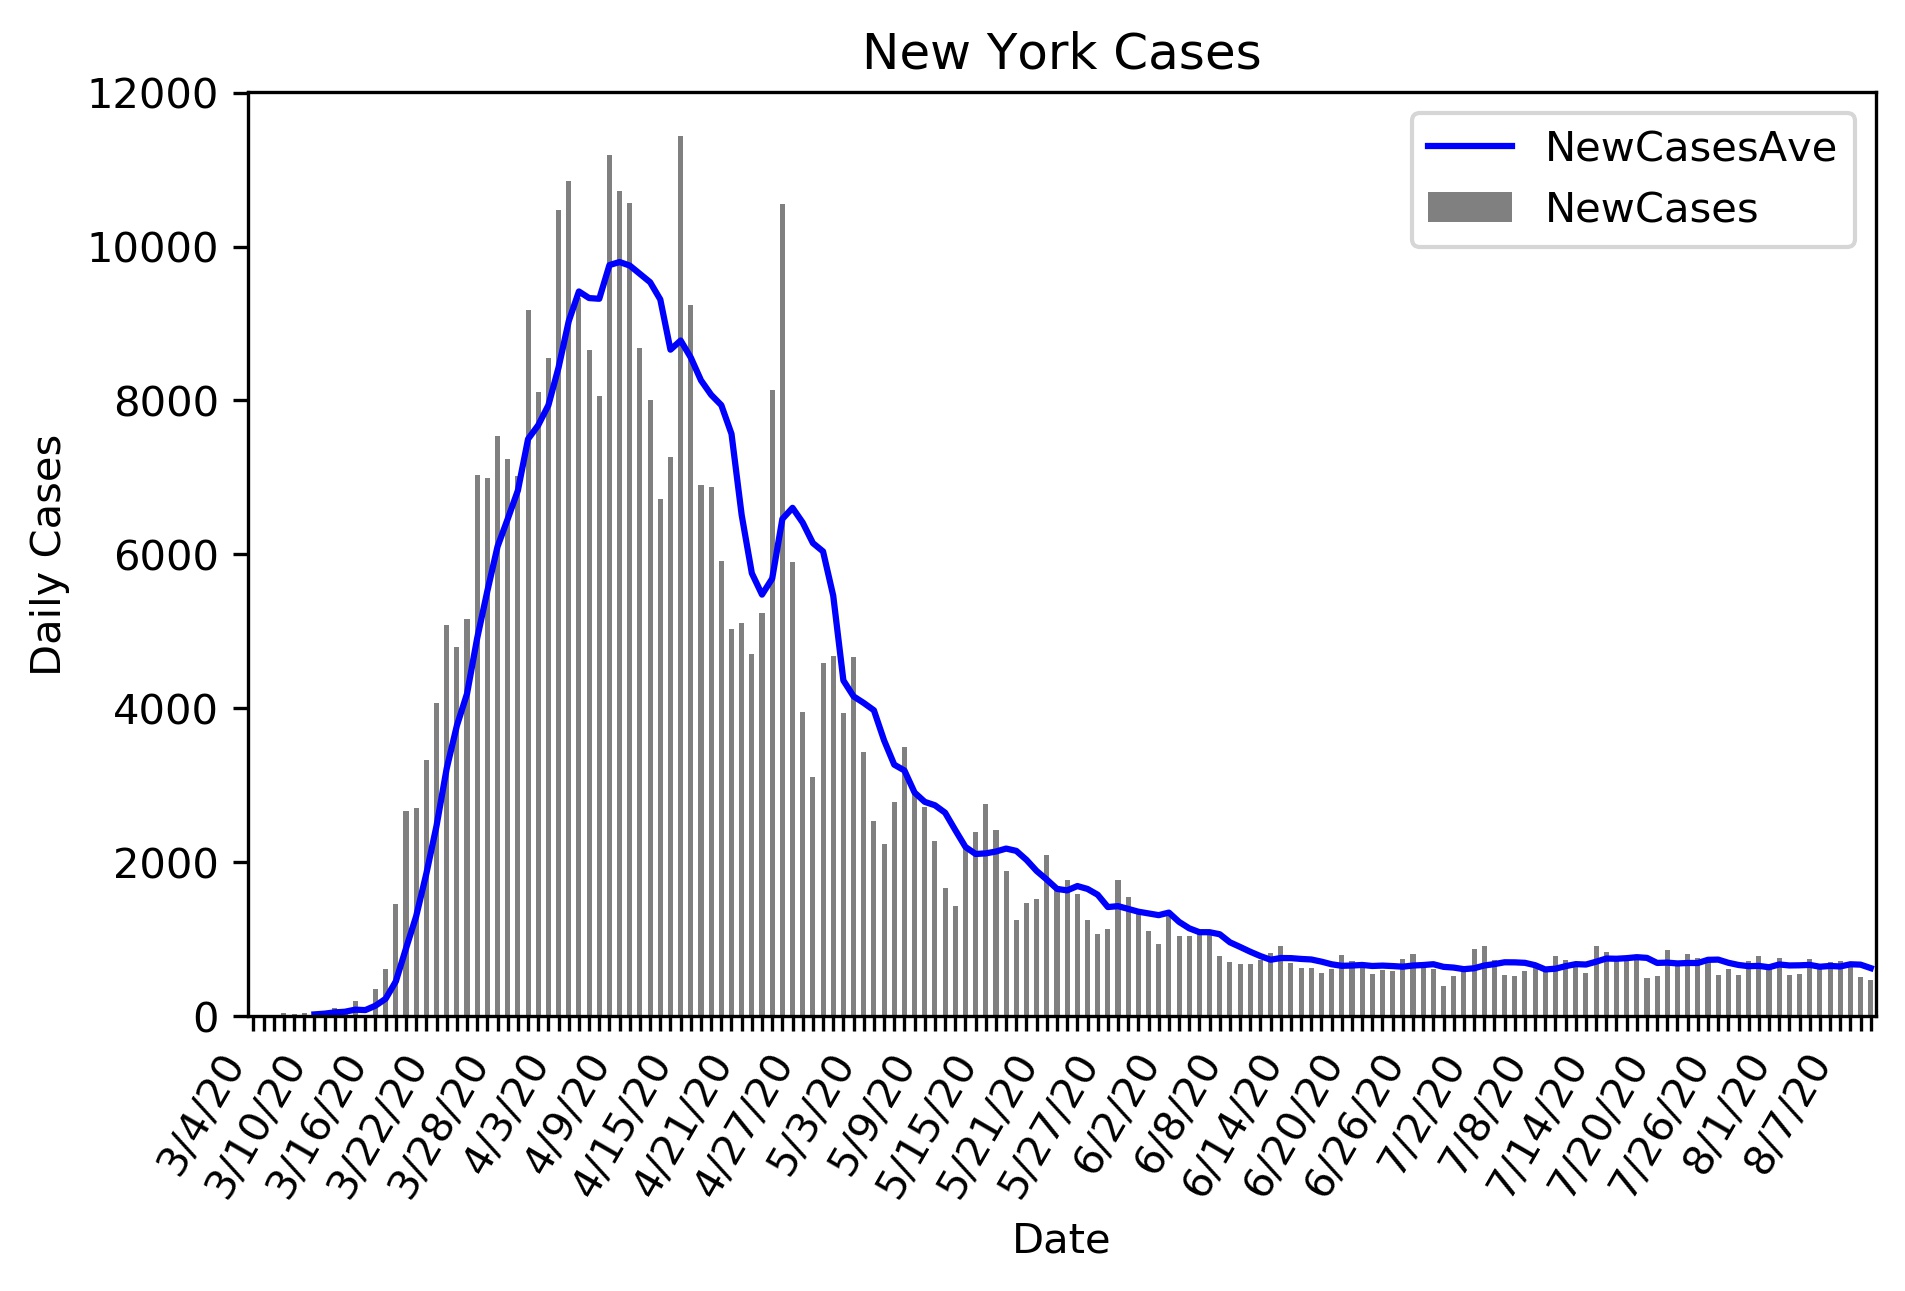
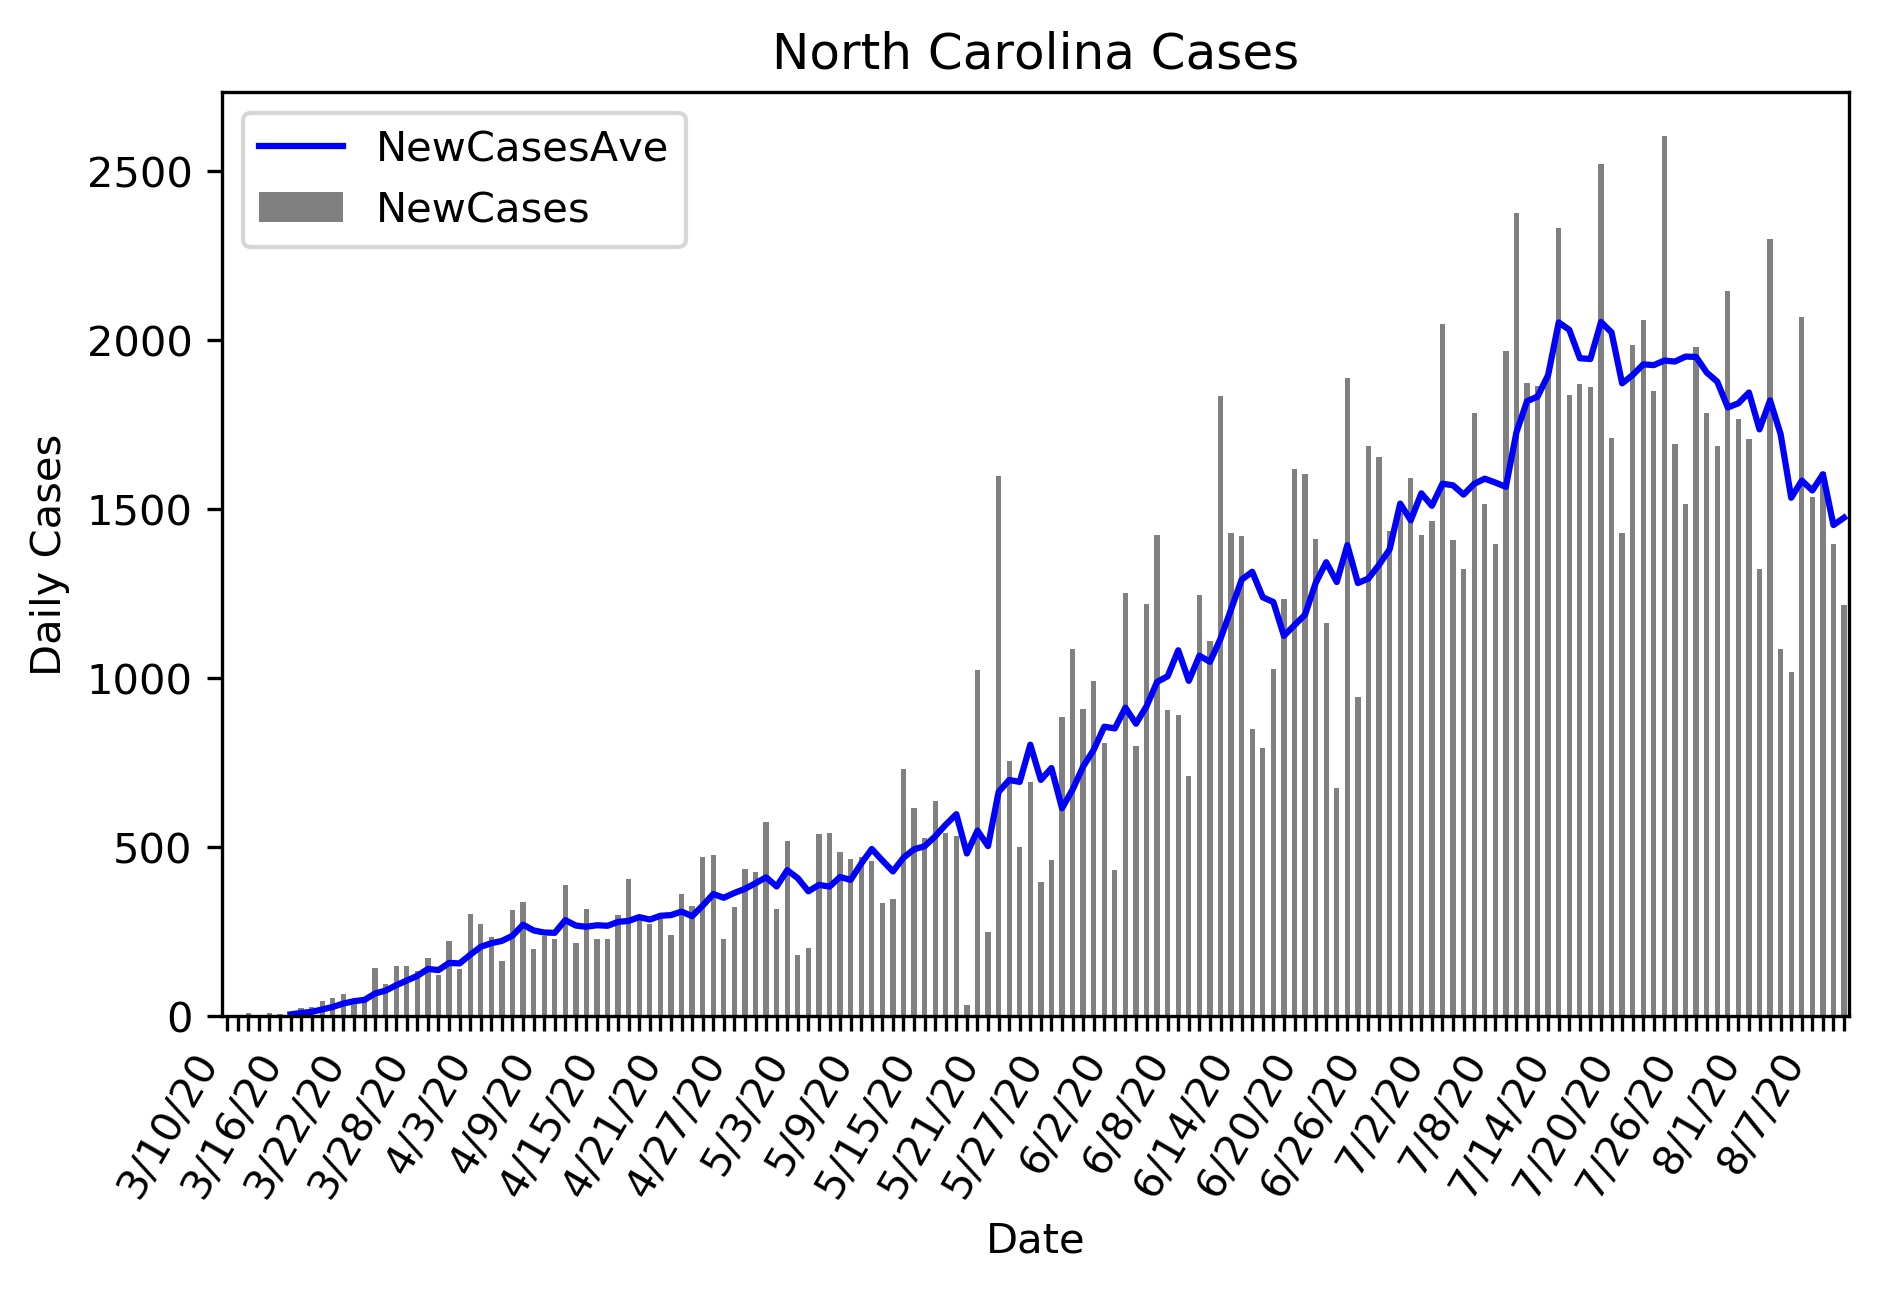
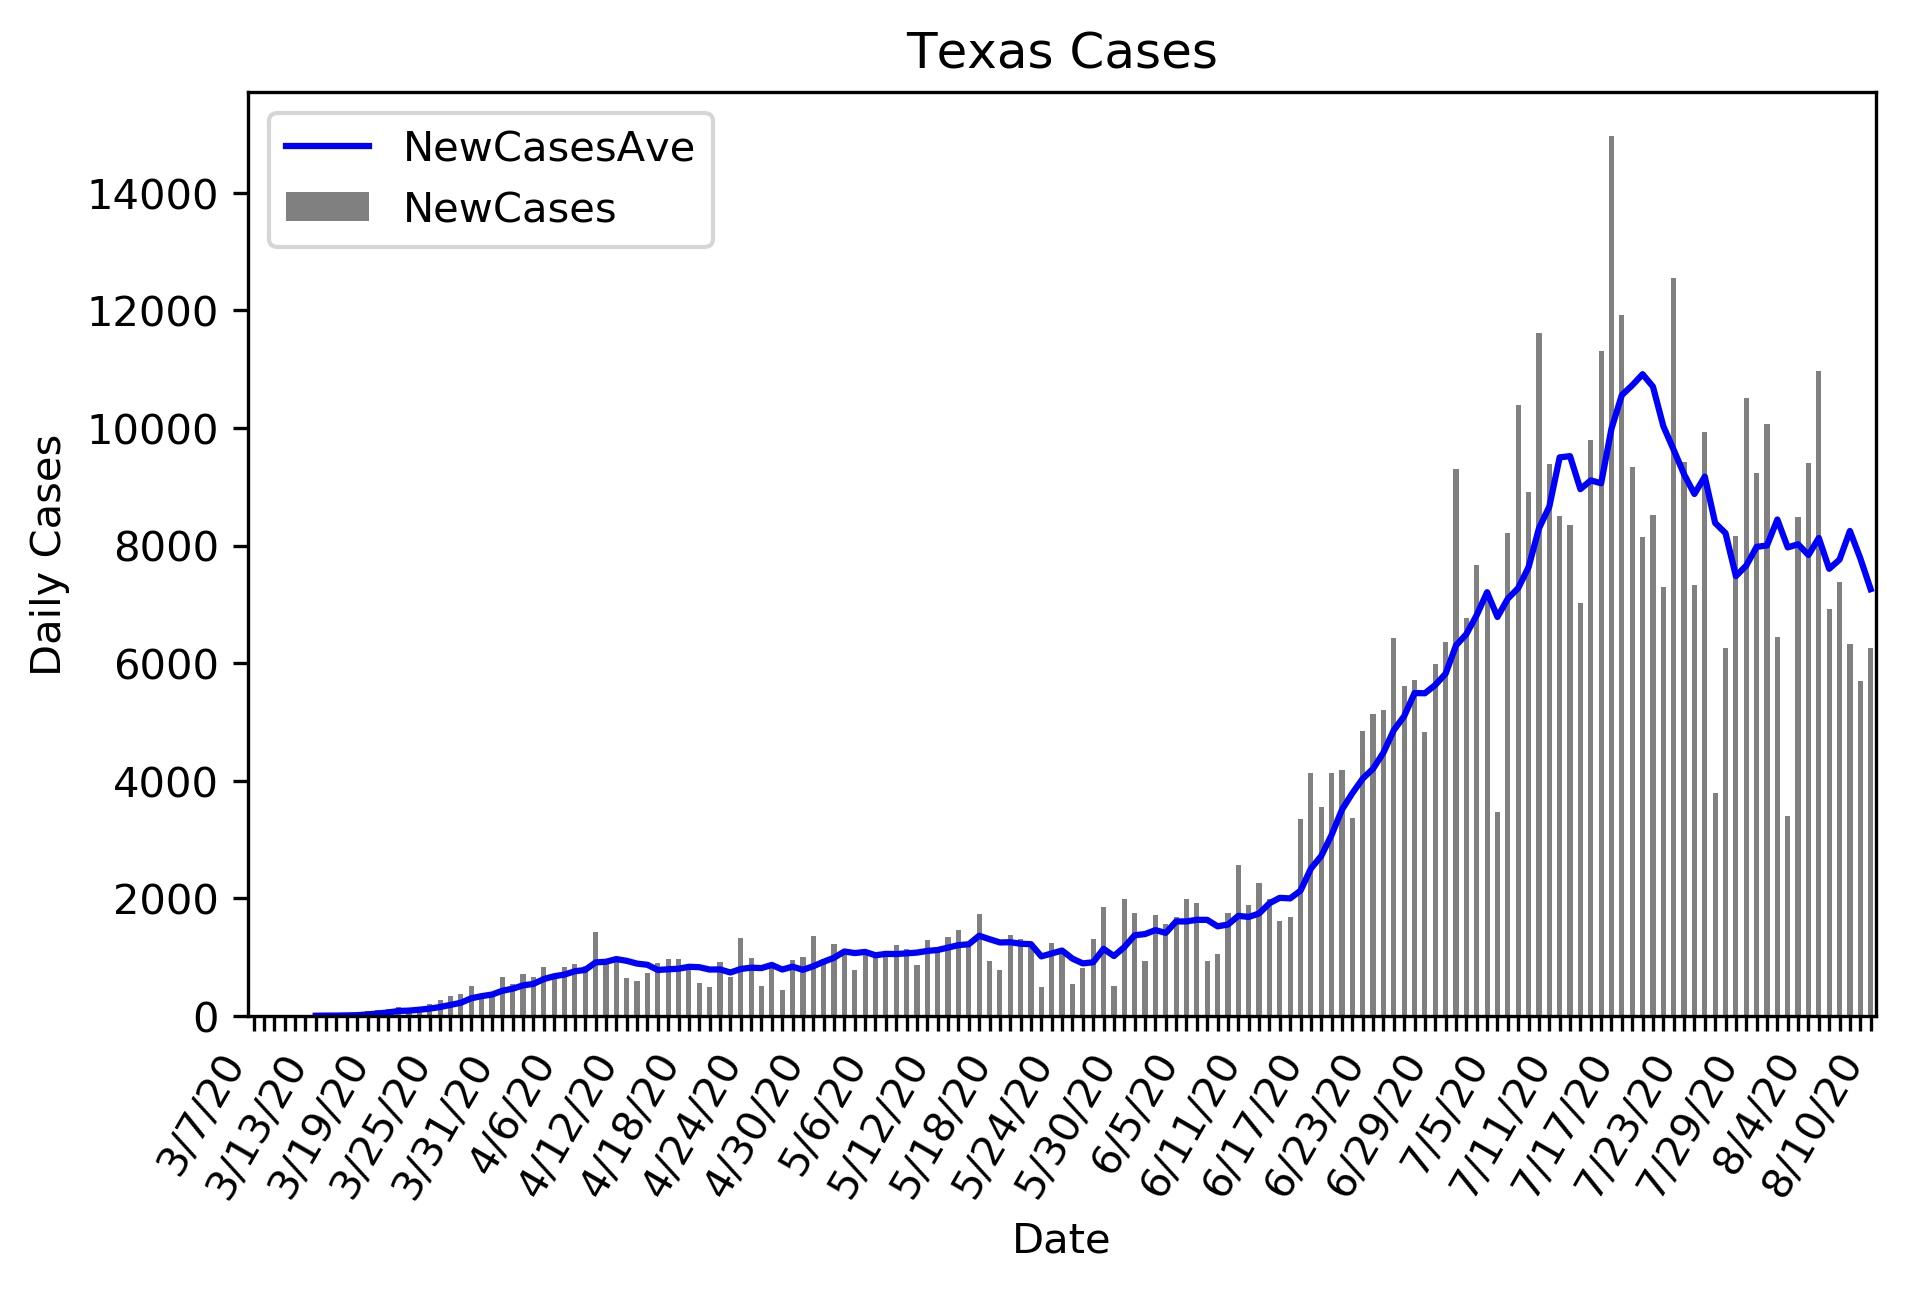
Cases per day. The line is a 5 day running average.
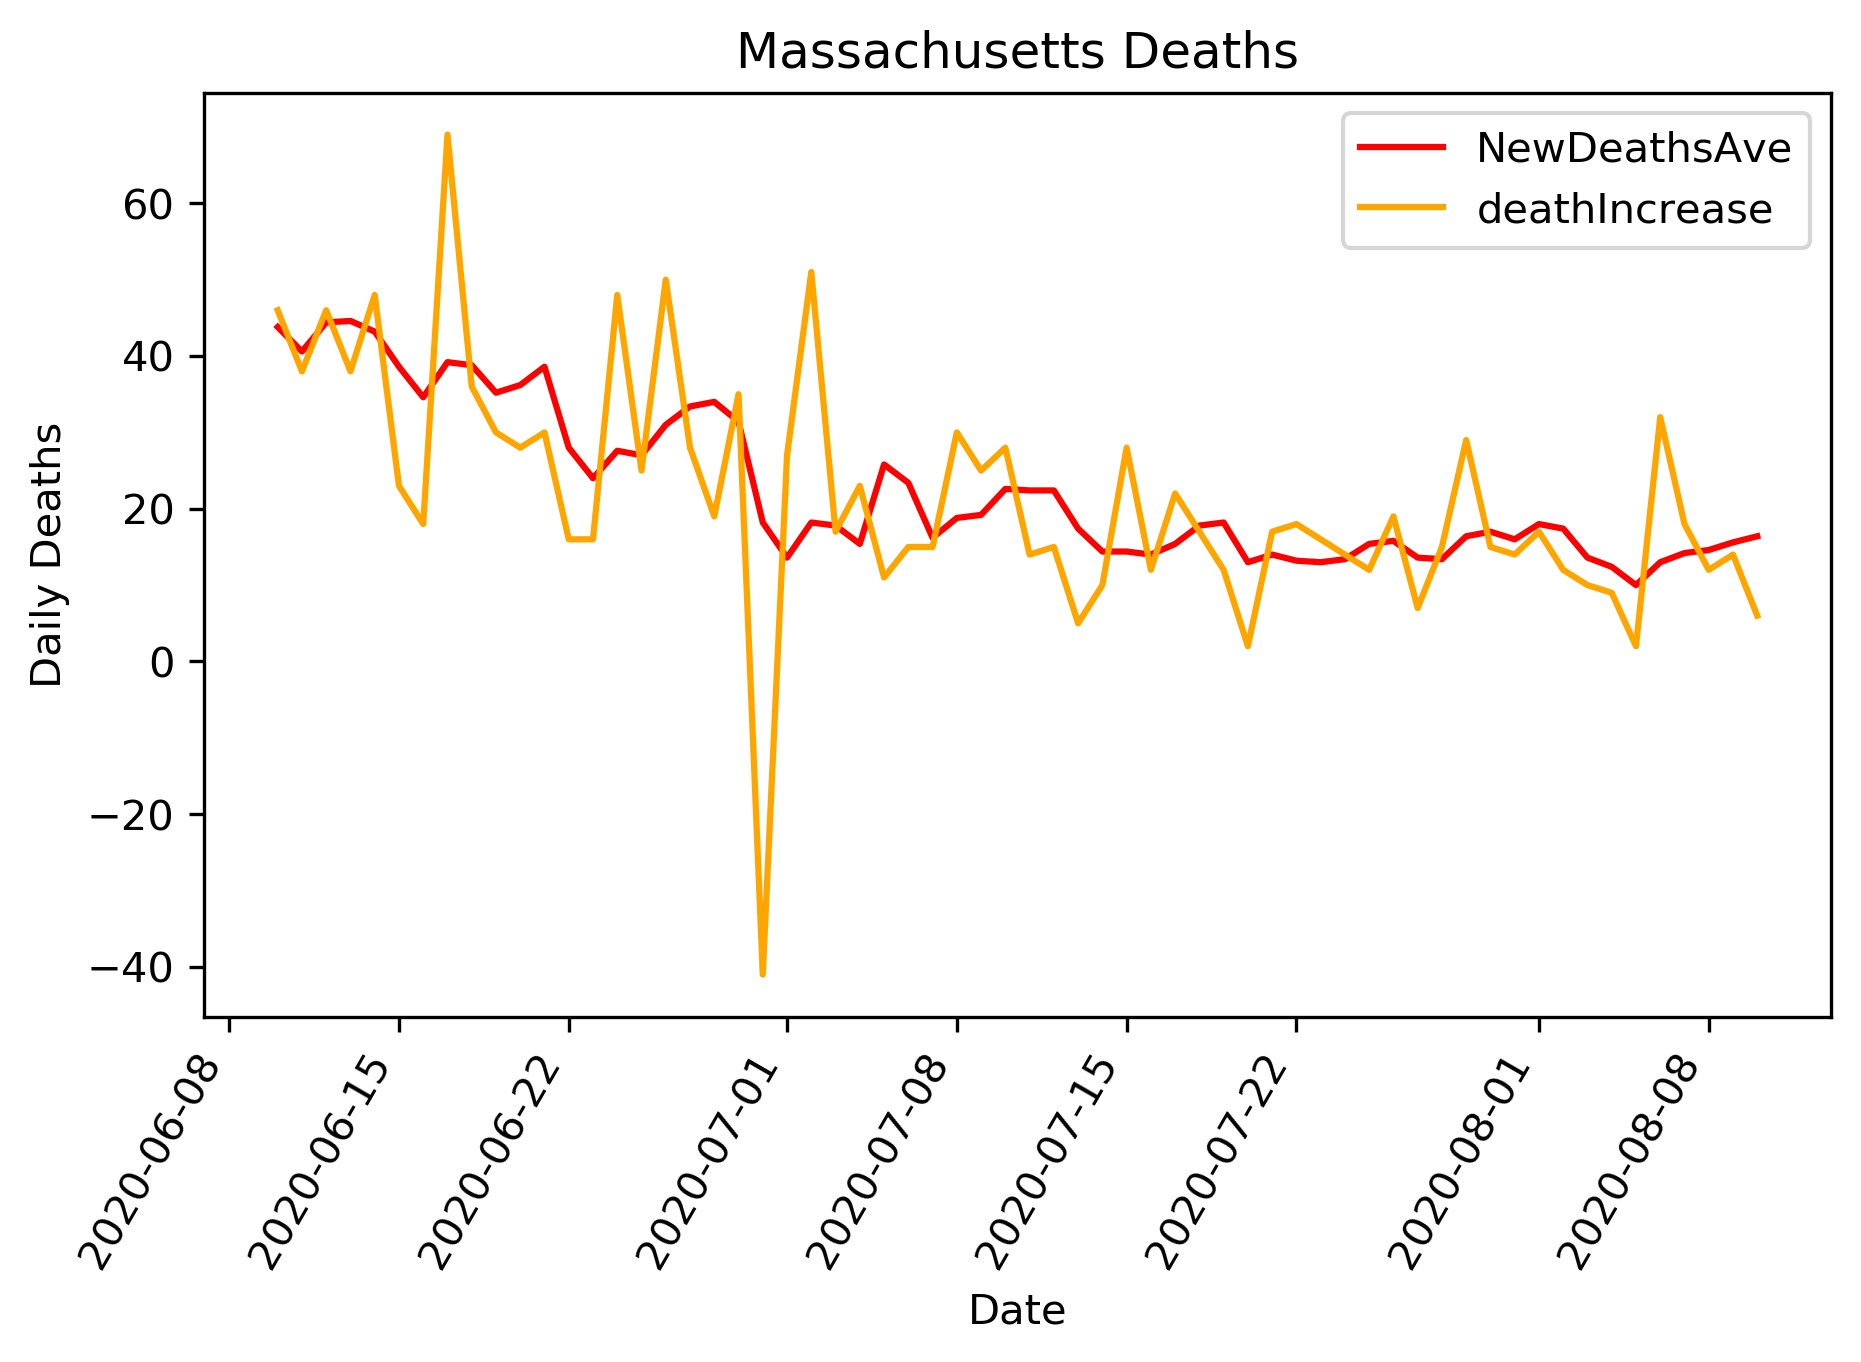
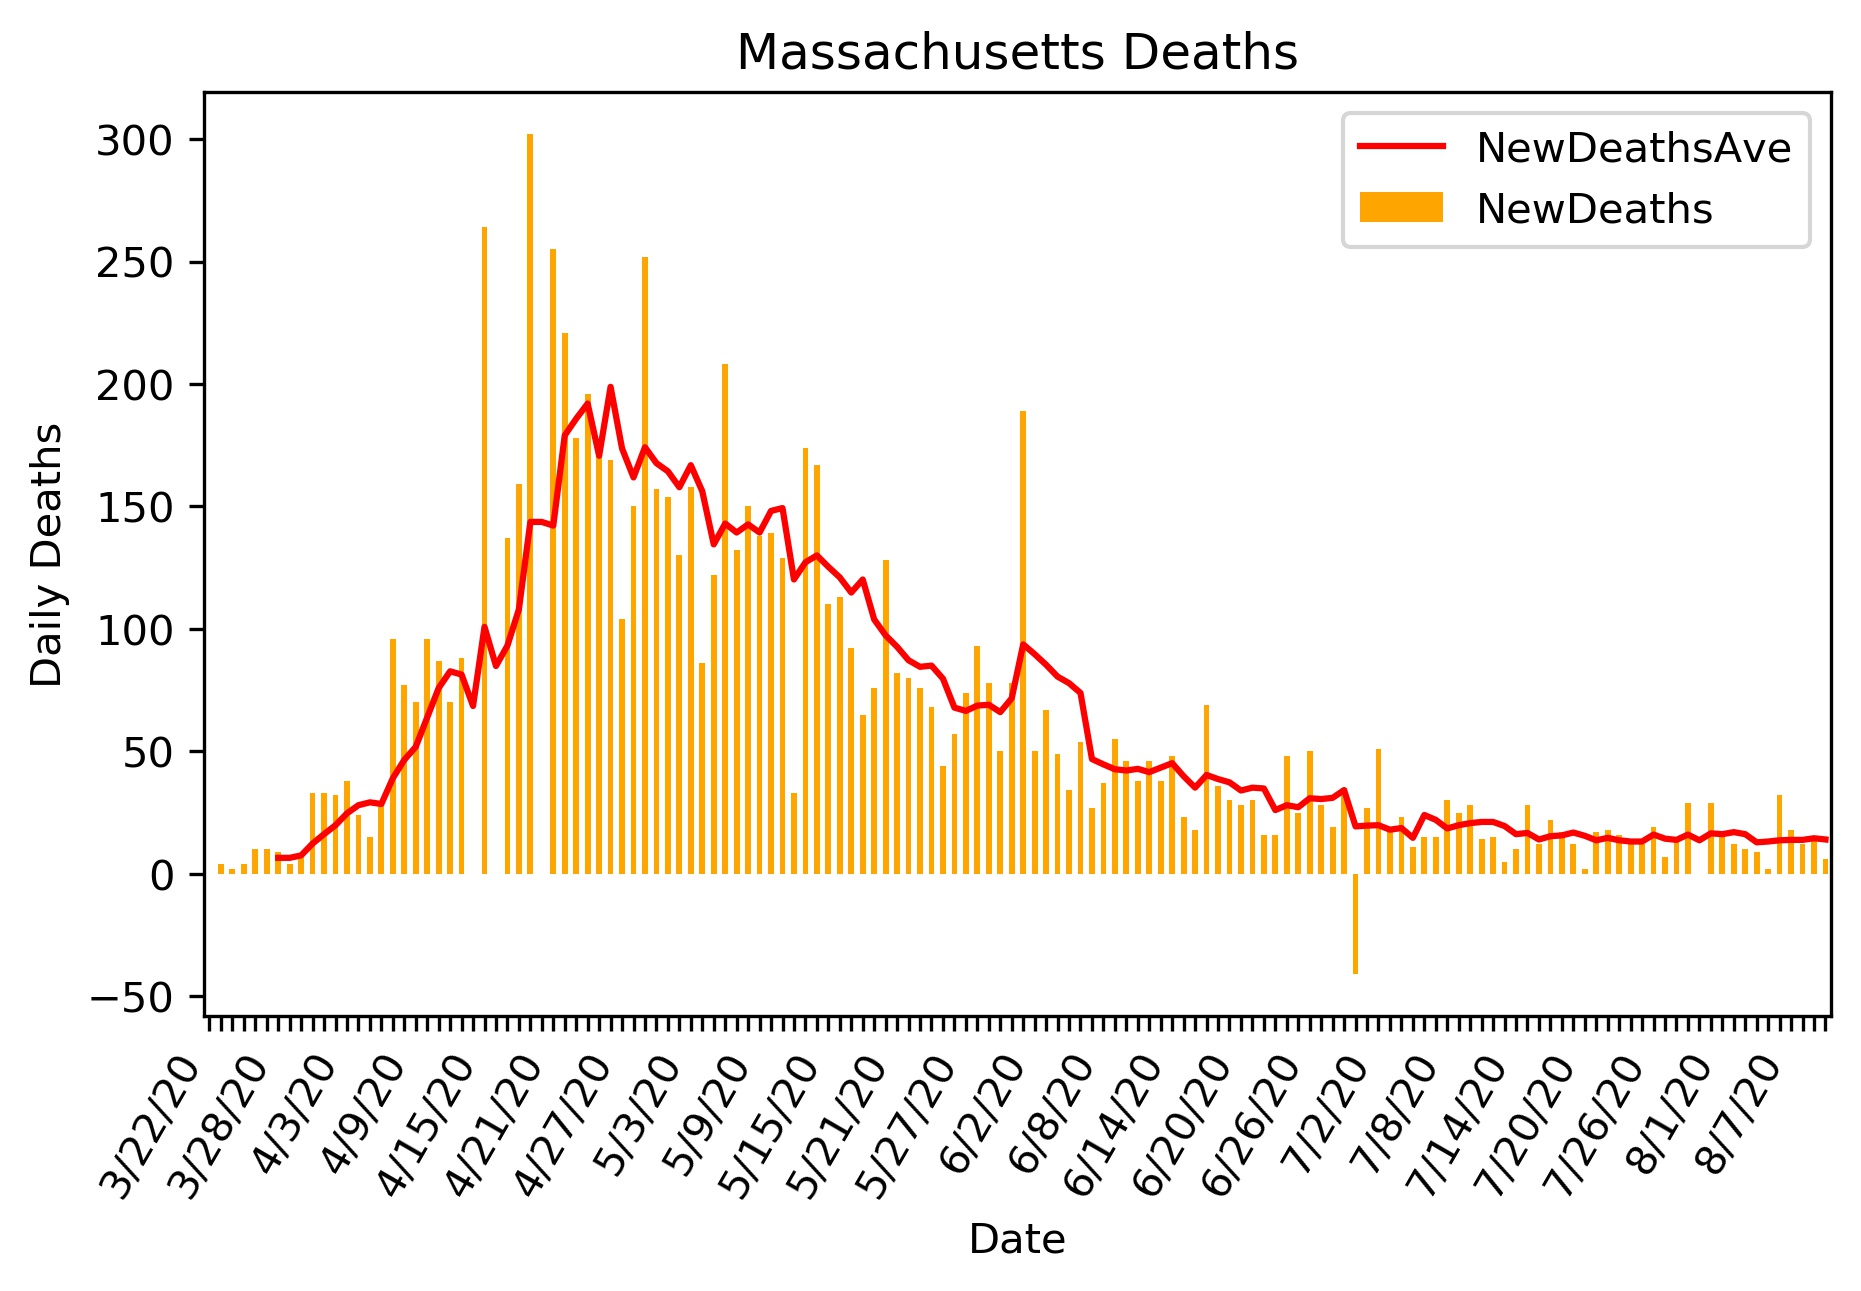
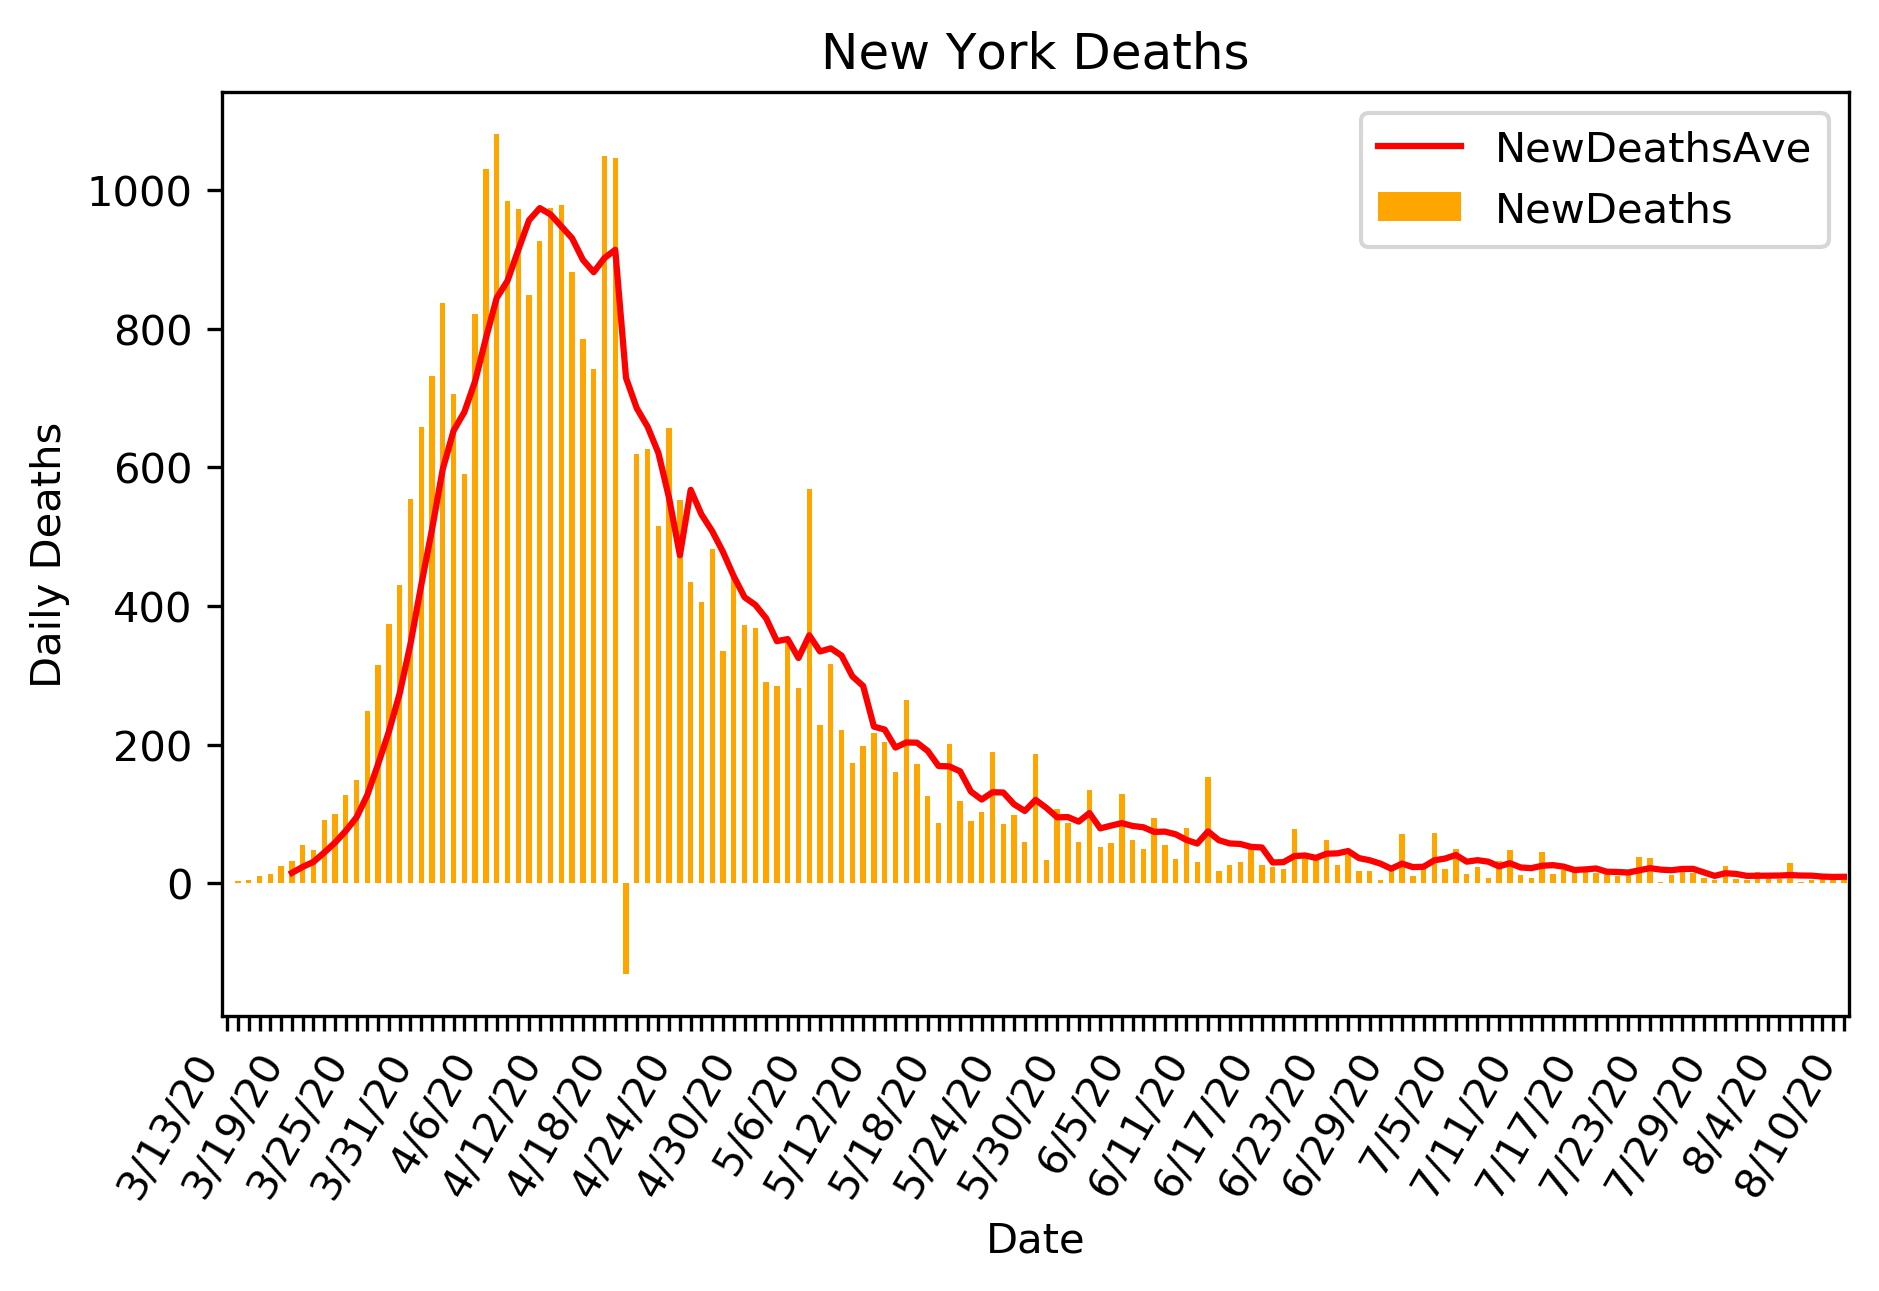
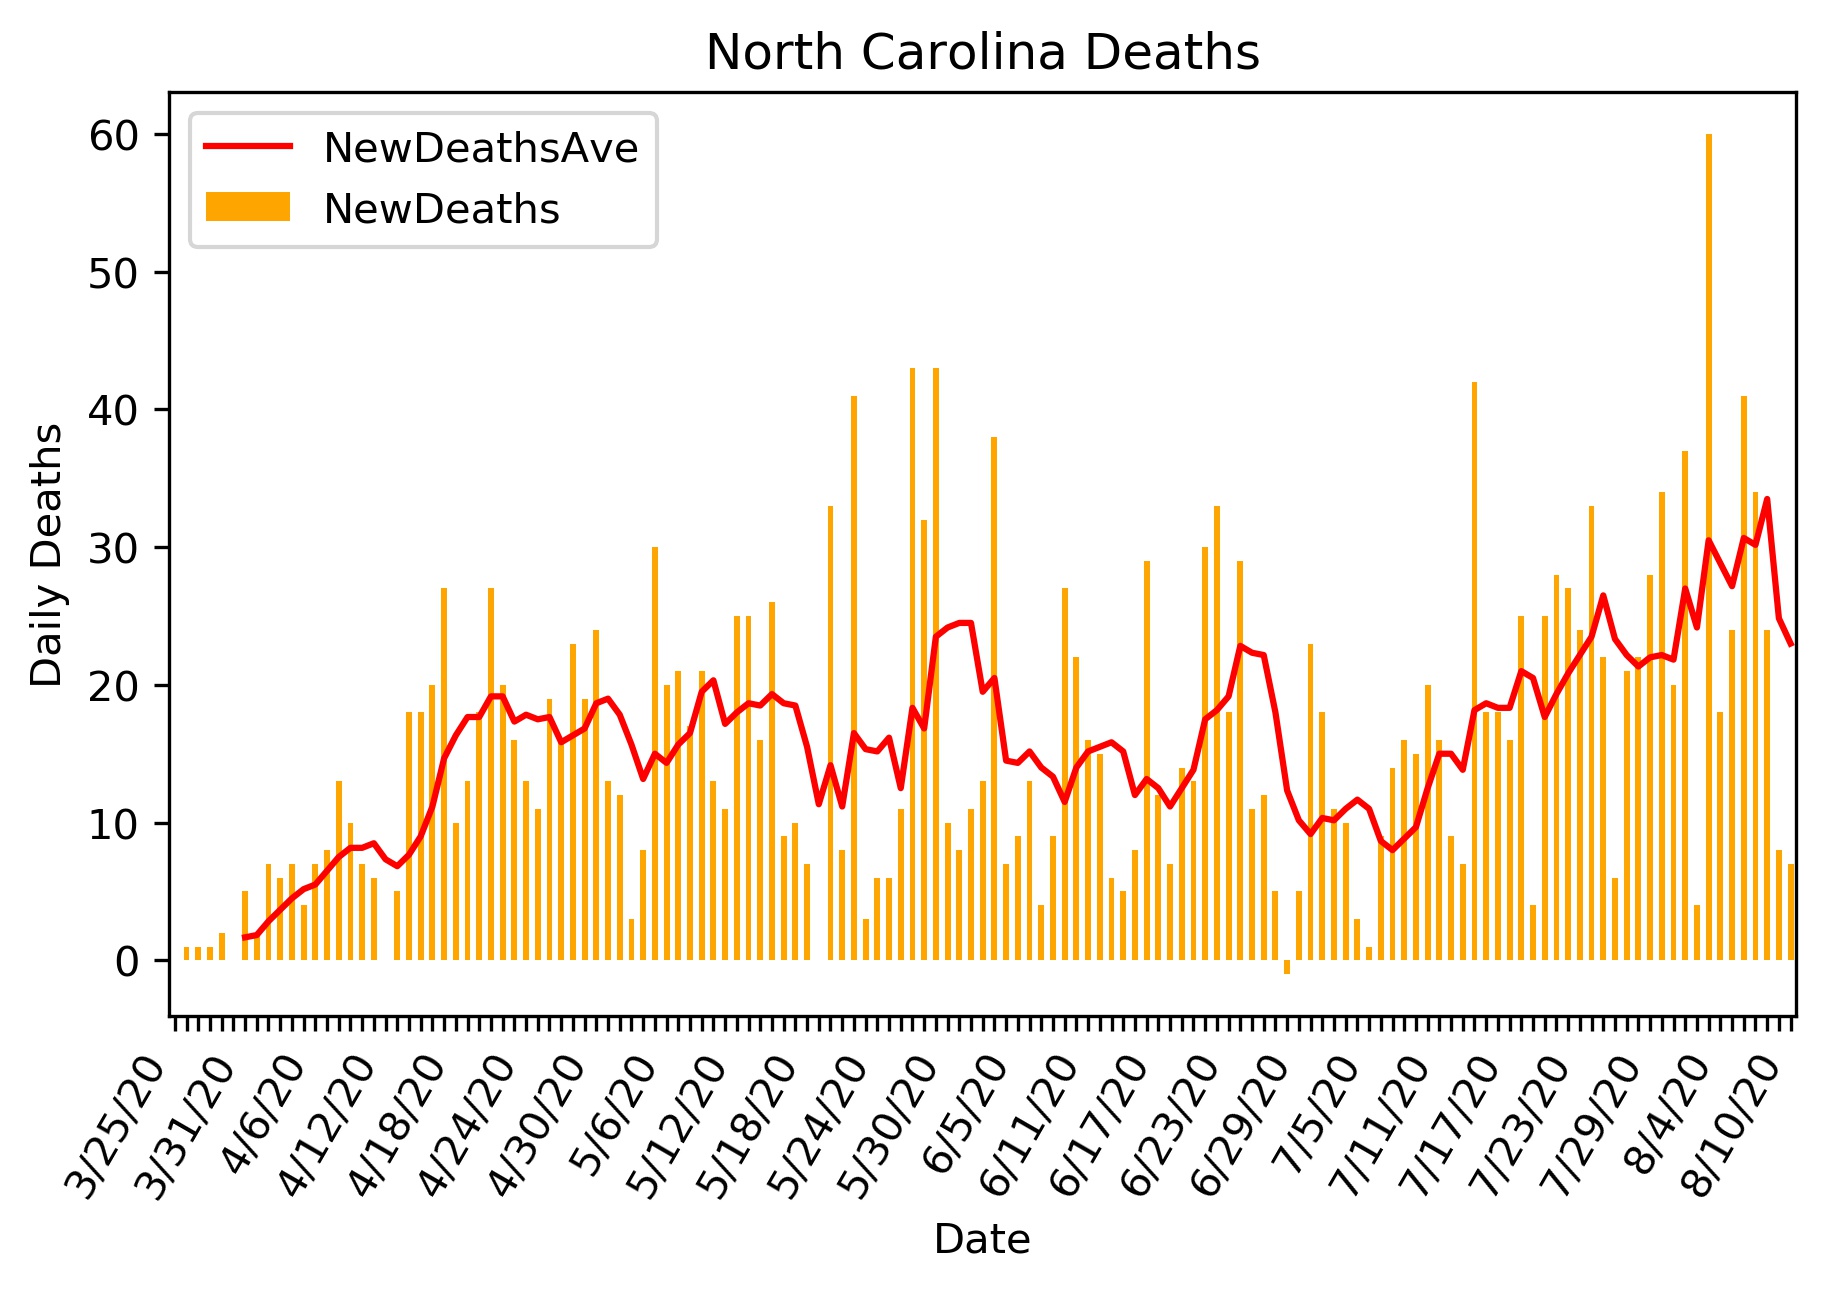
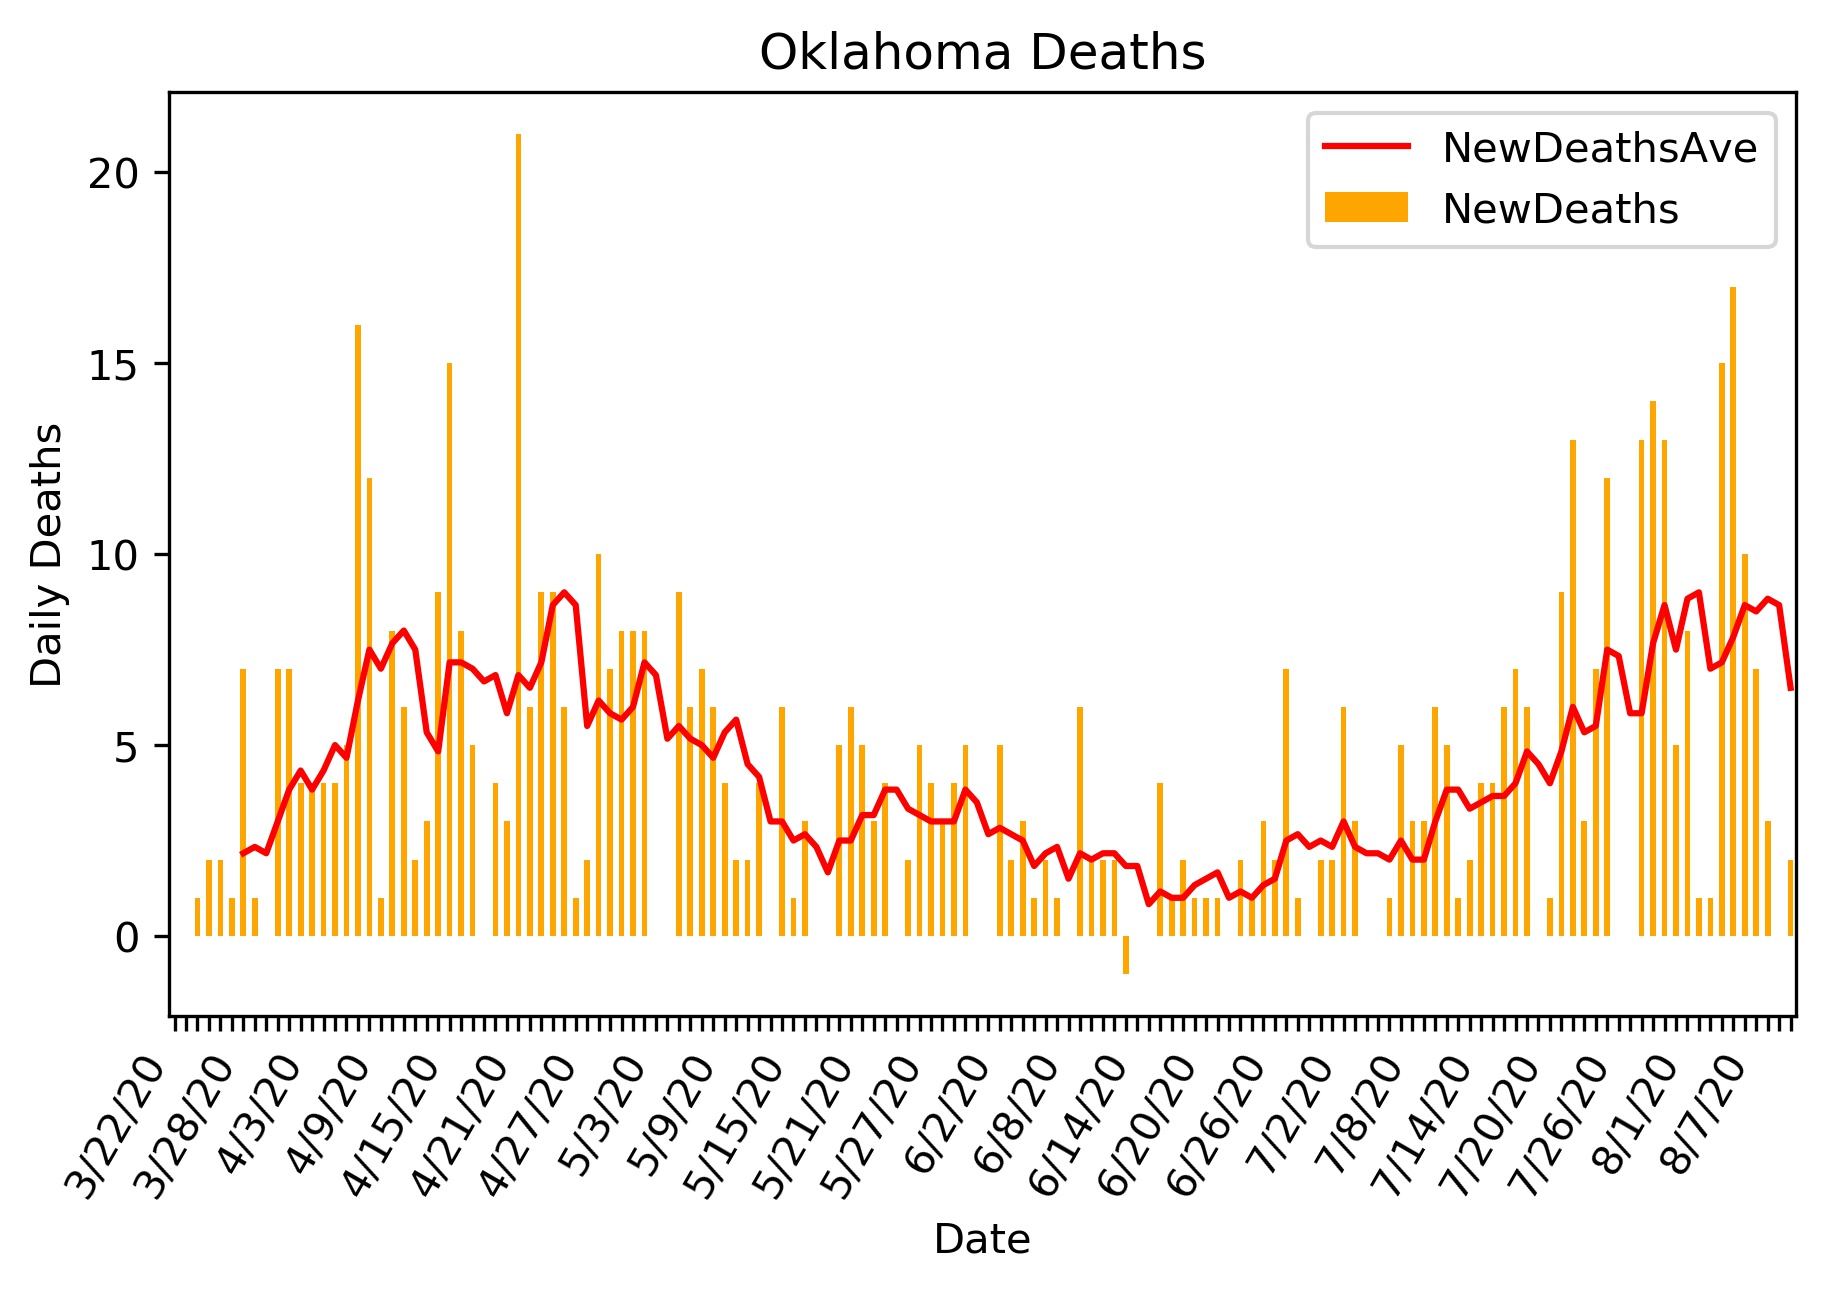
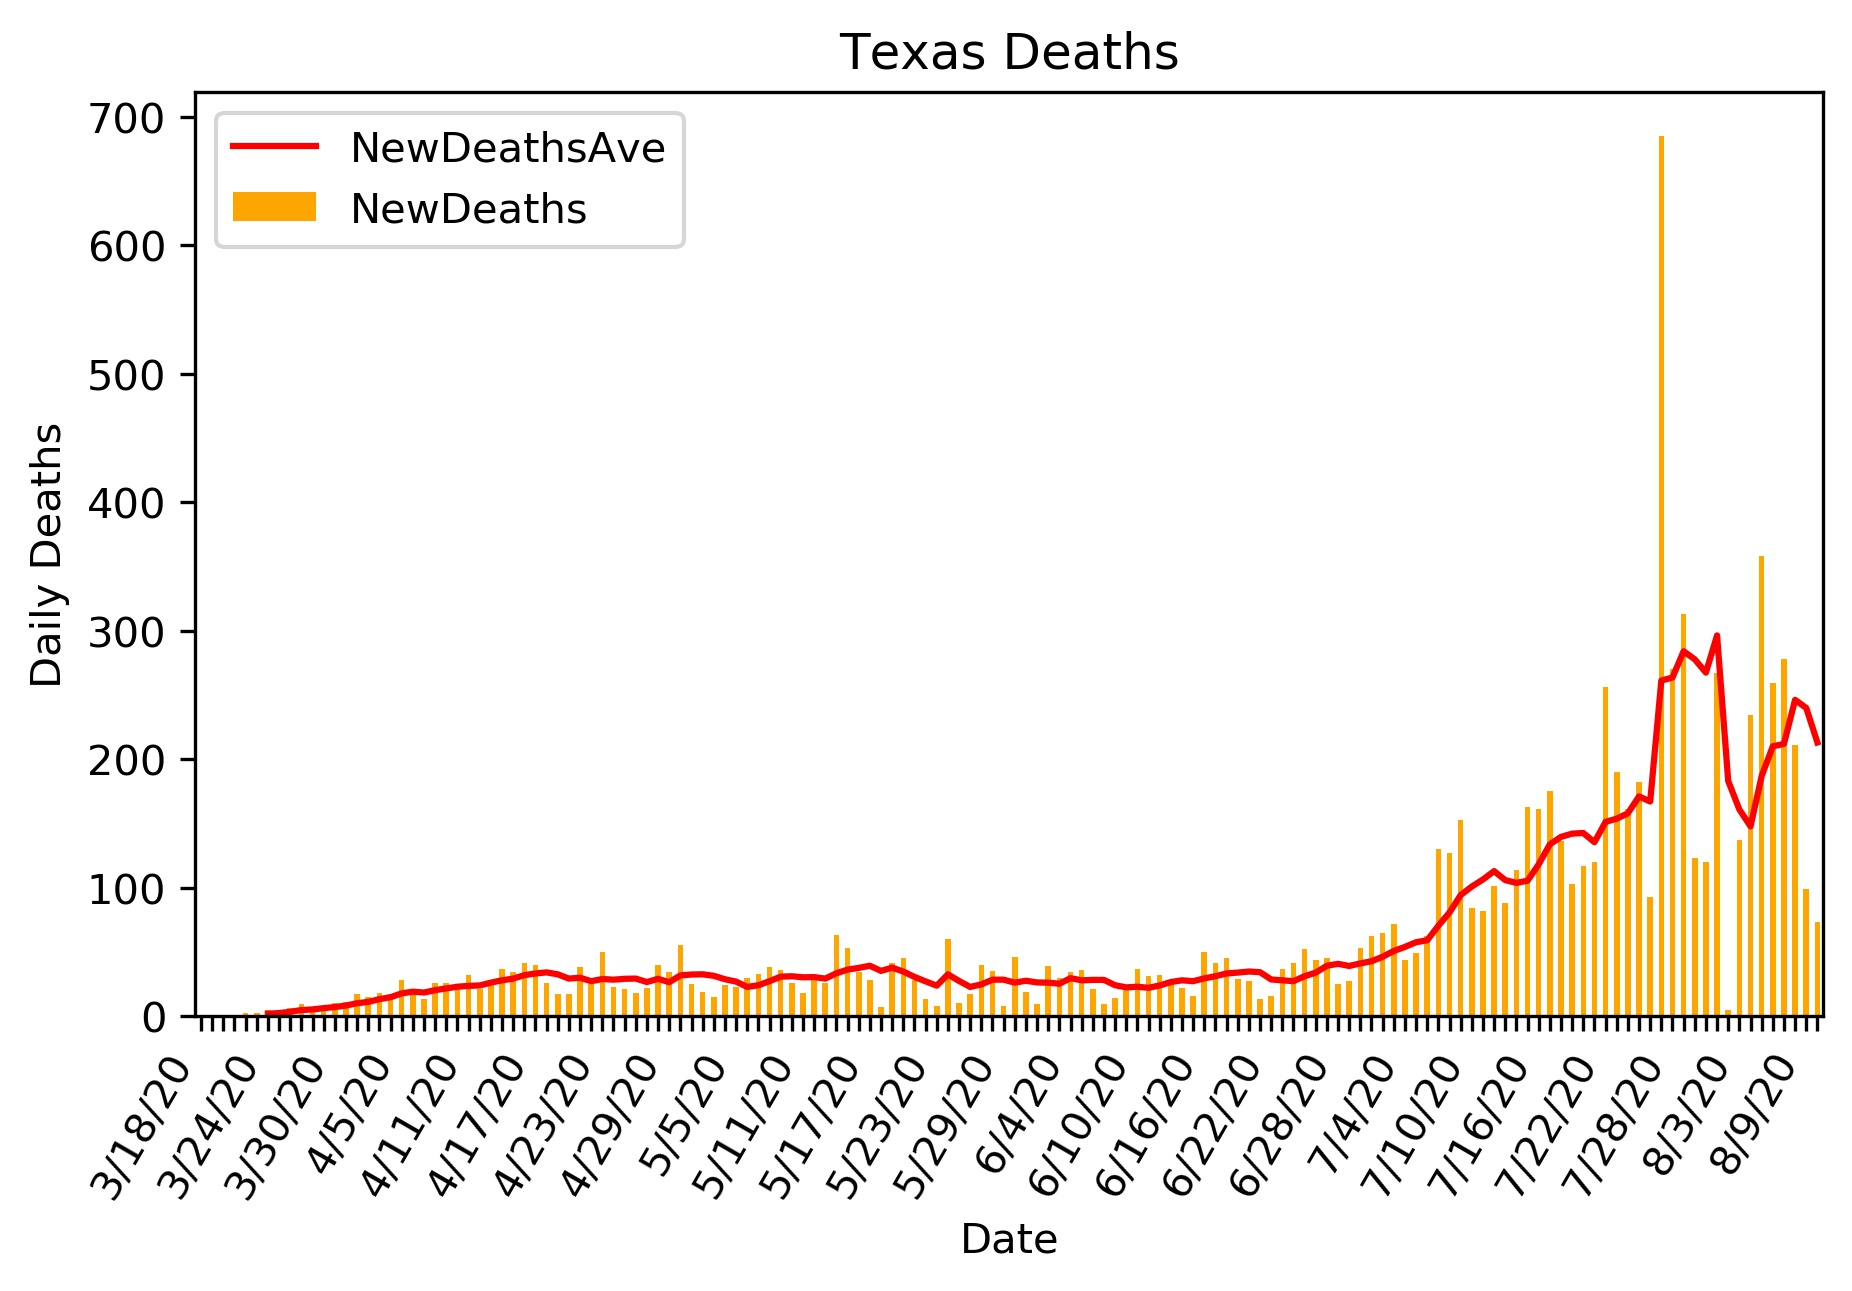
Deaths per day. The line is a 5 day running average.
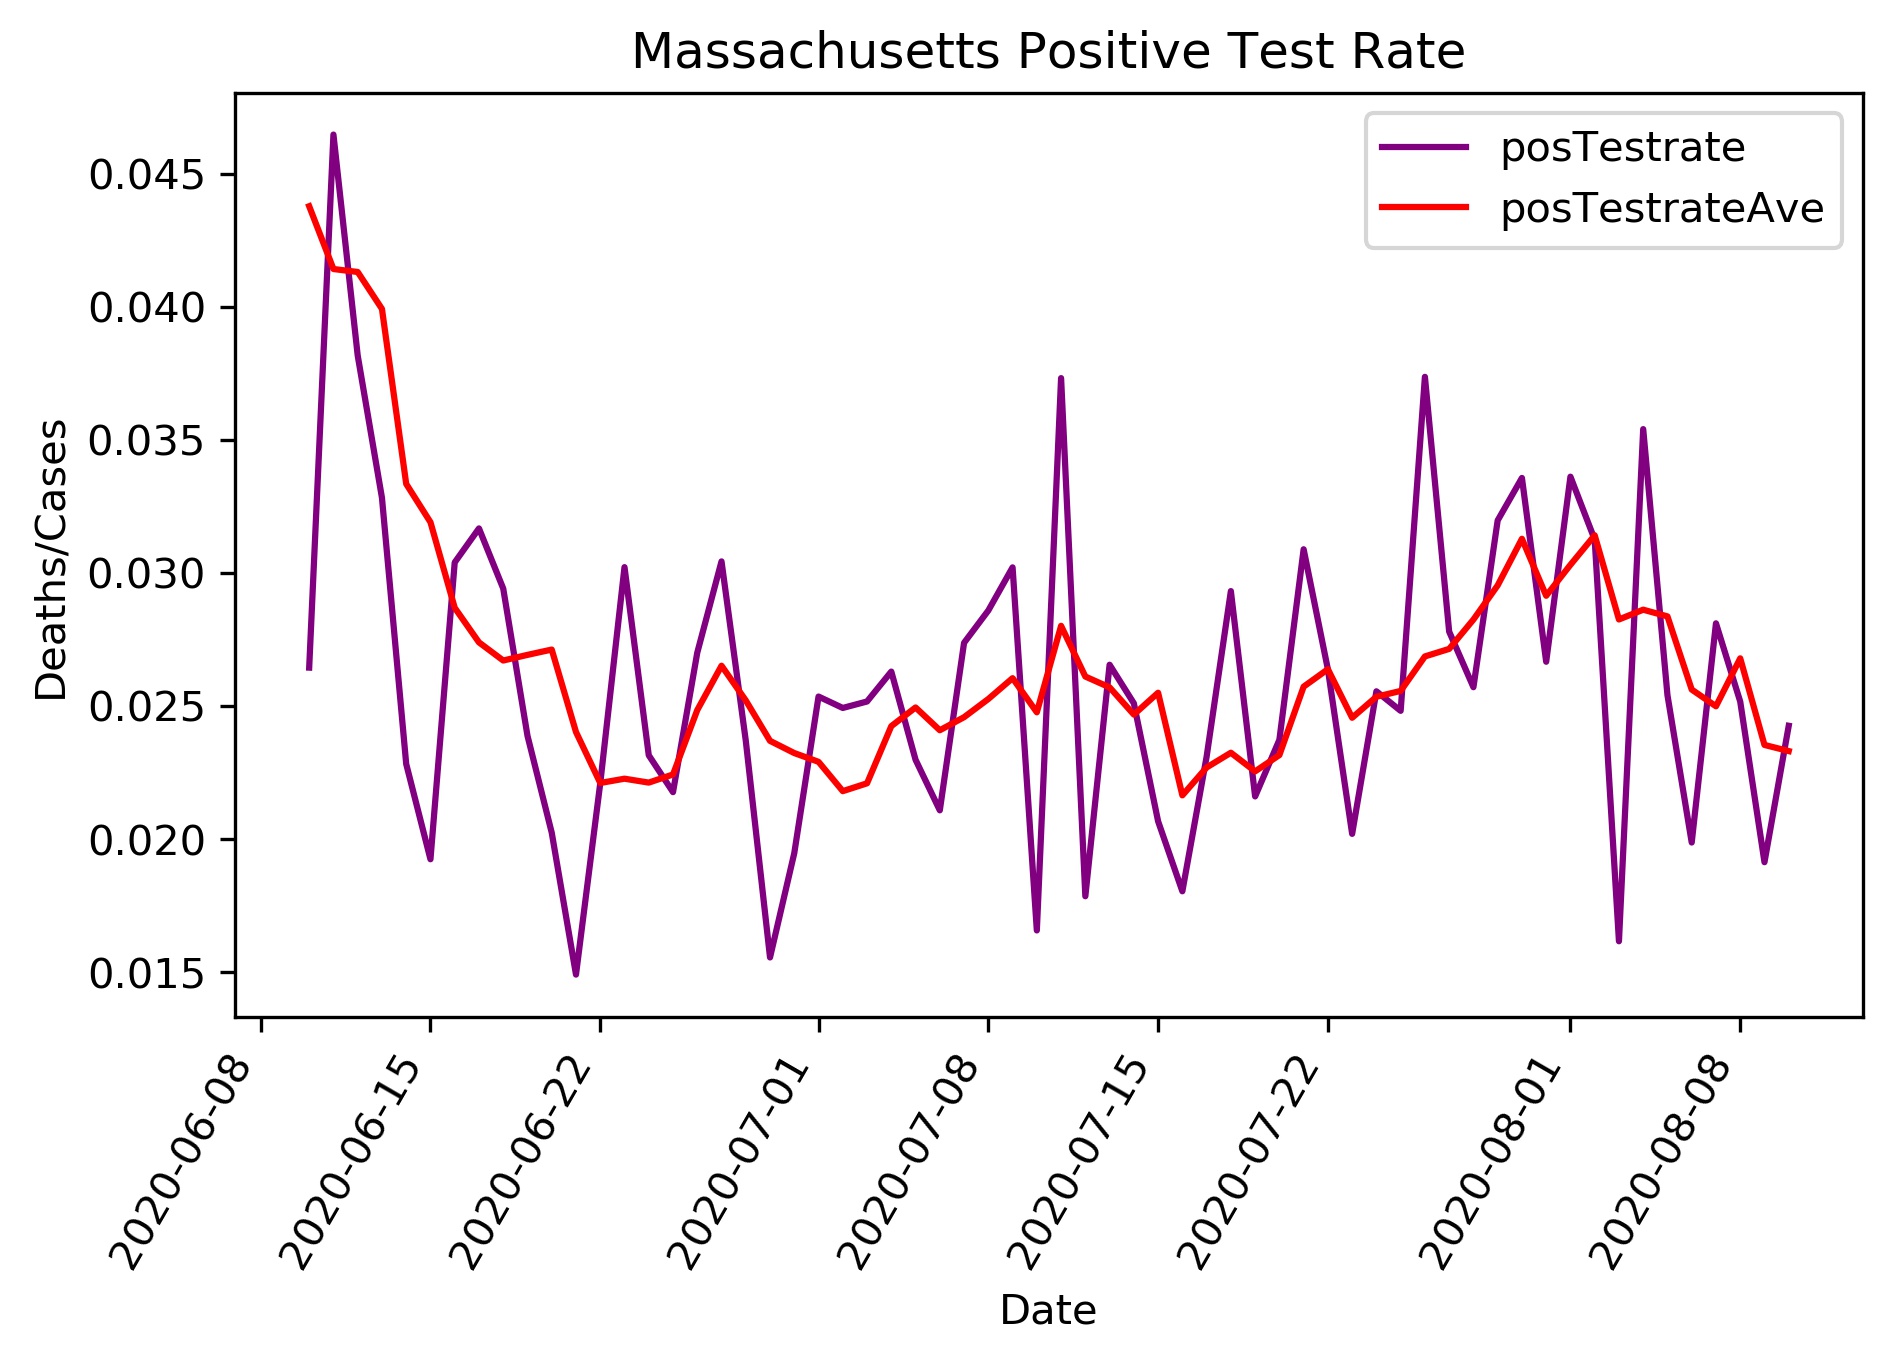
Positive test rate.
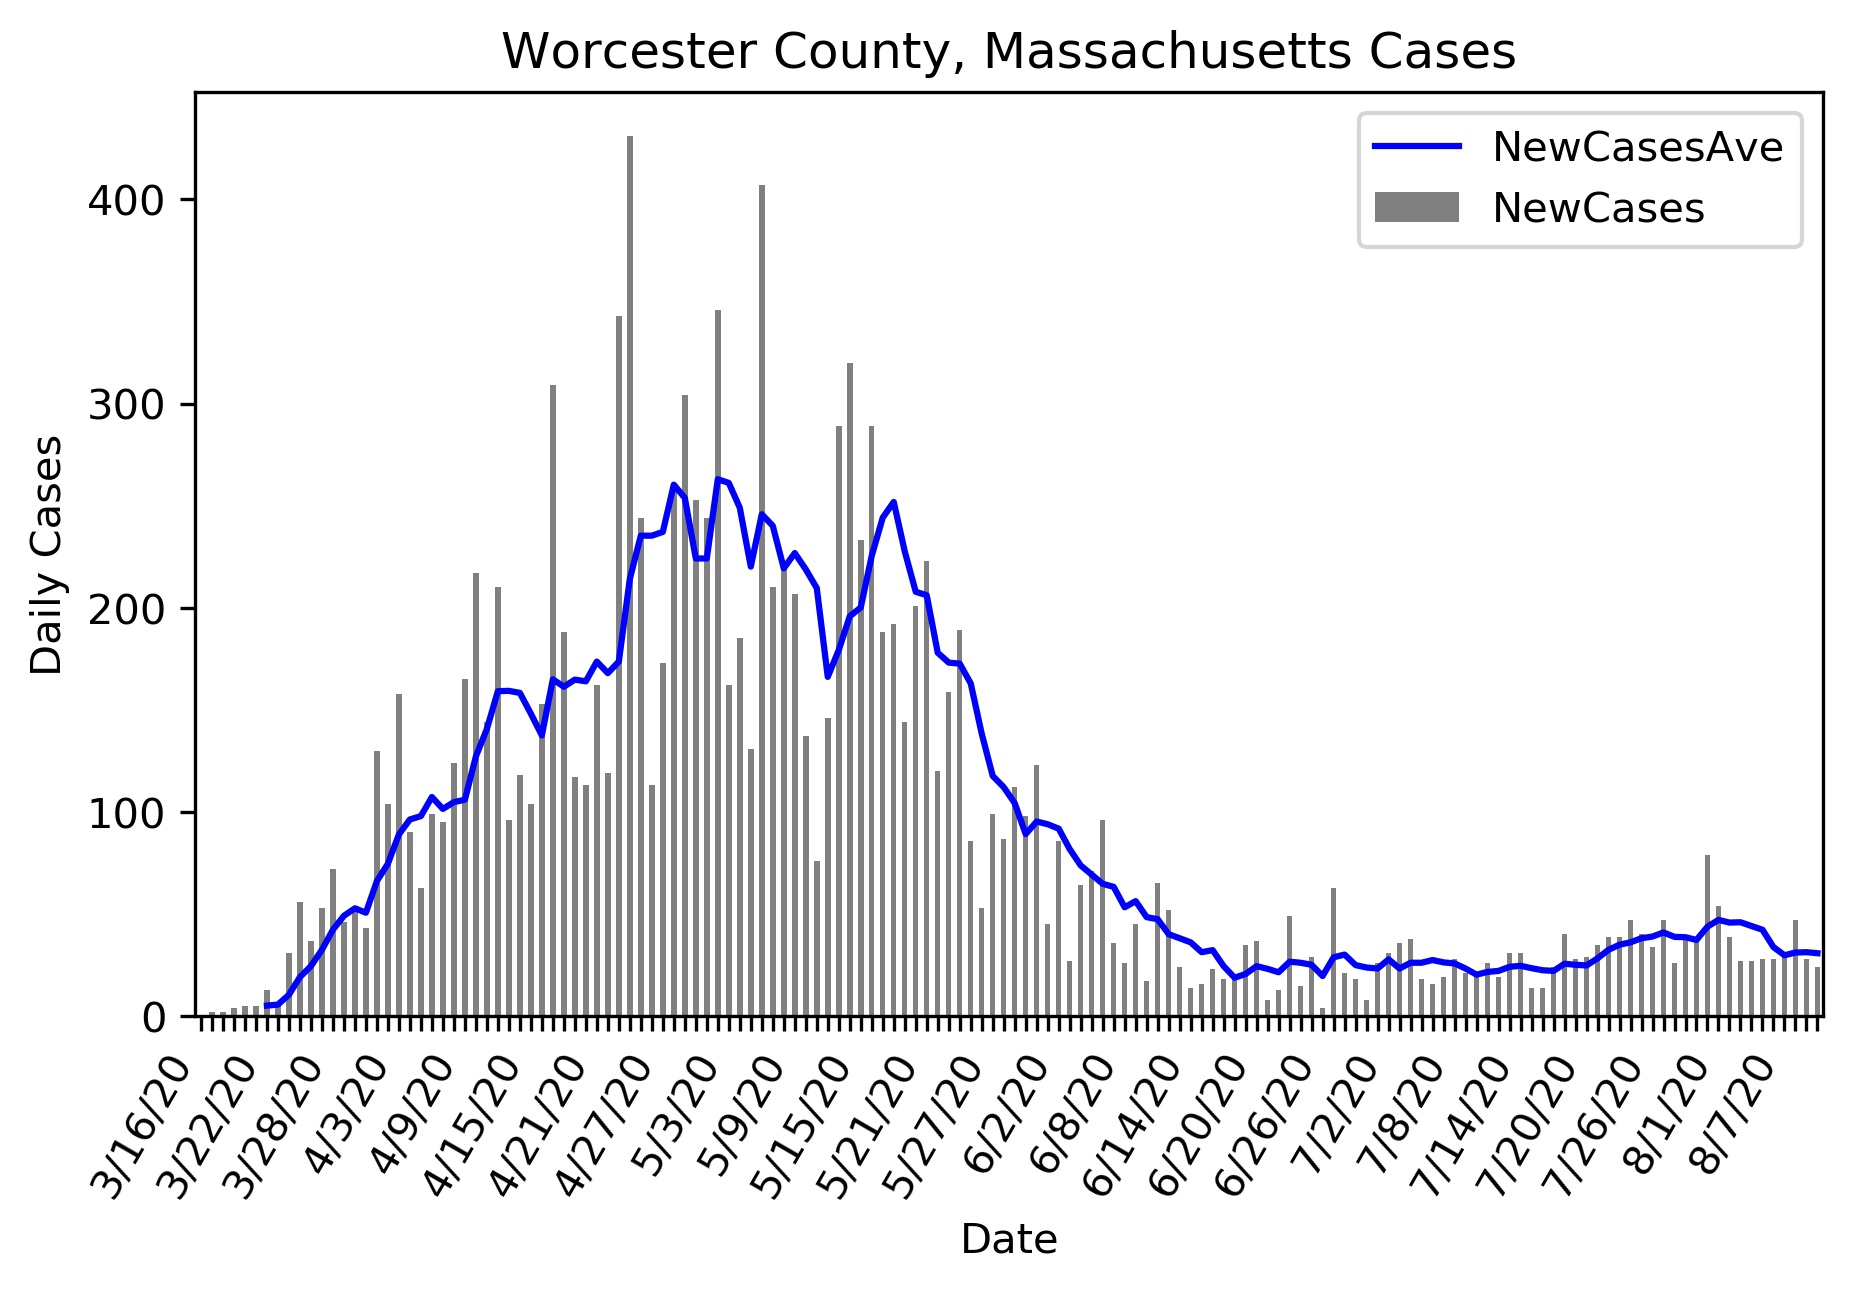
Worcester Data
Cases per day. The line is a 5 day running average.
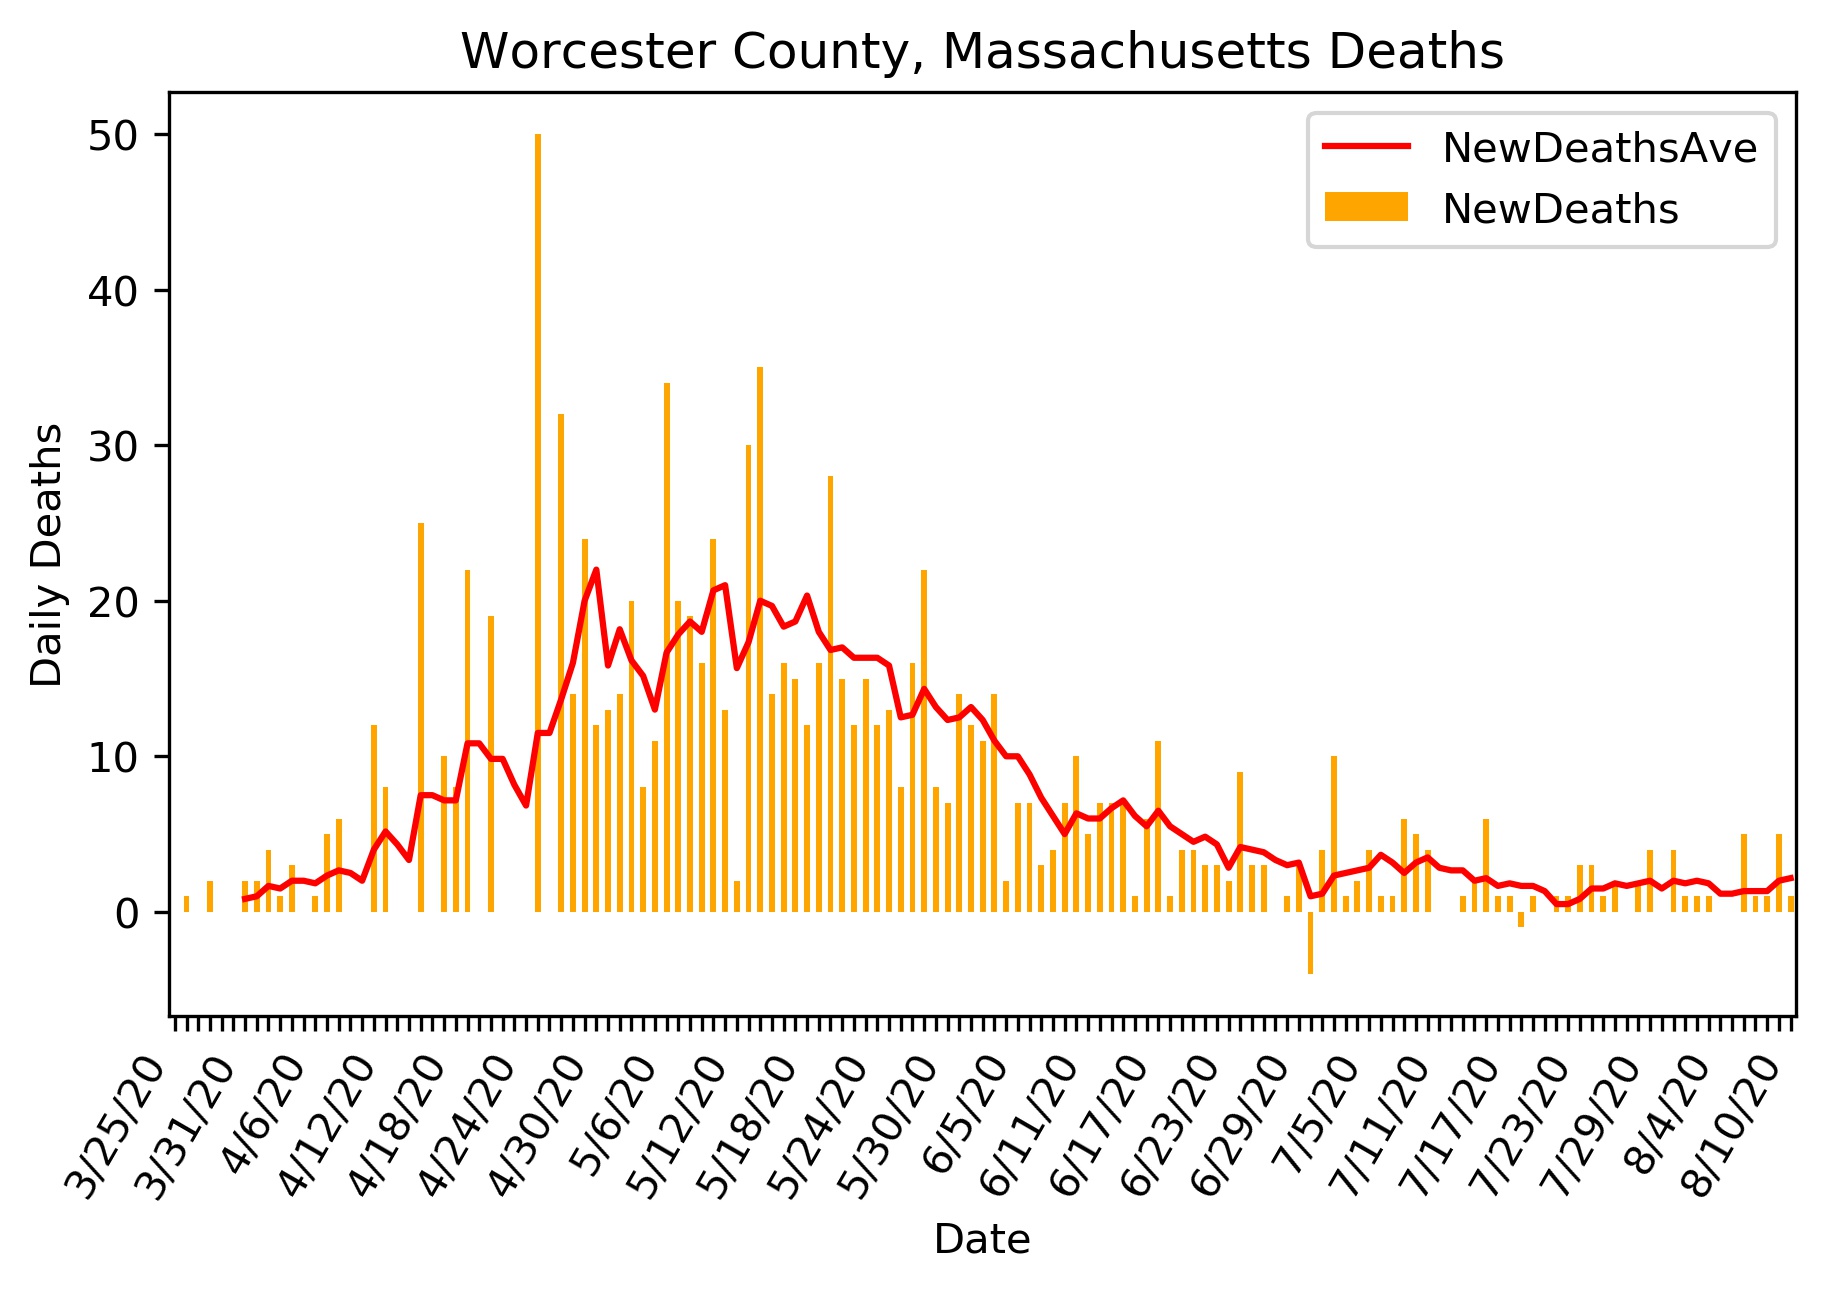
Deaths per day. The line is a 5 day running average.
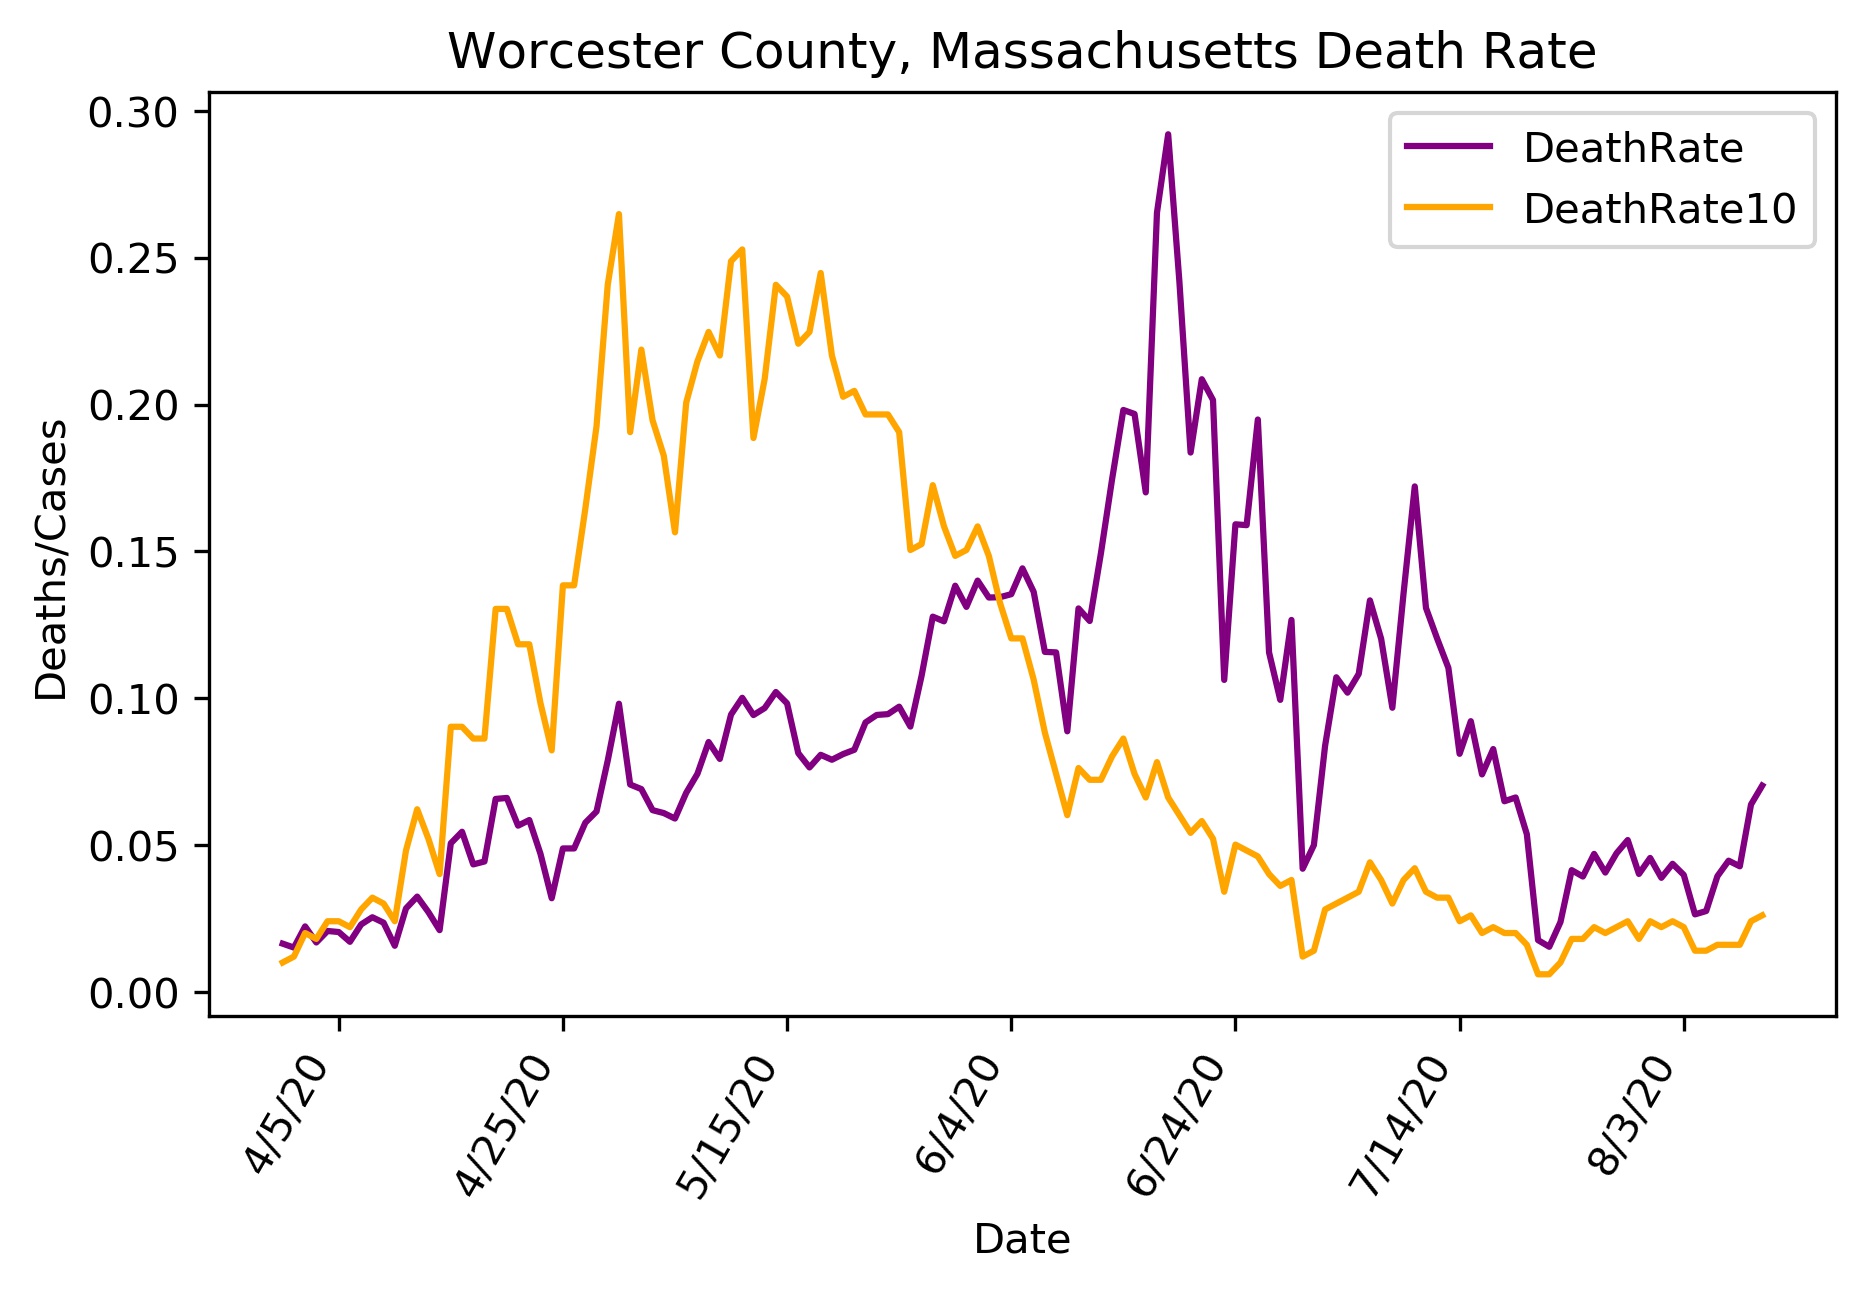
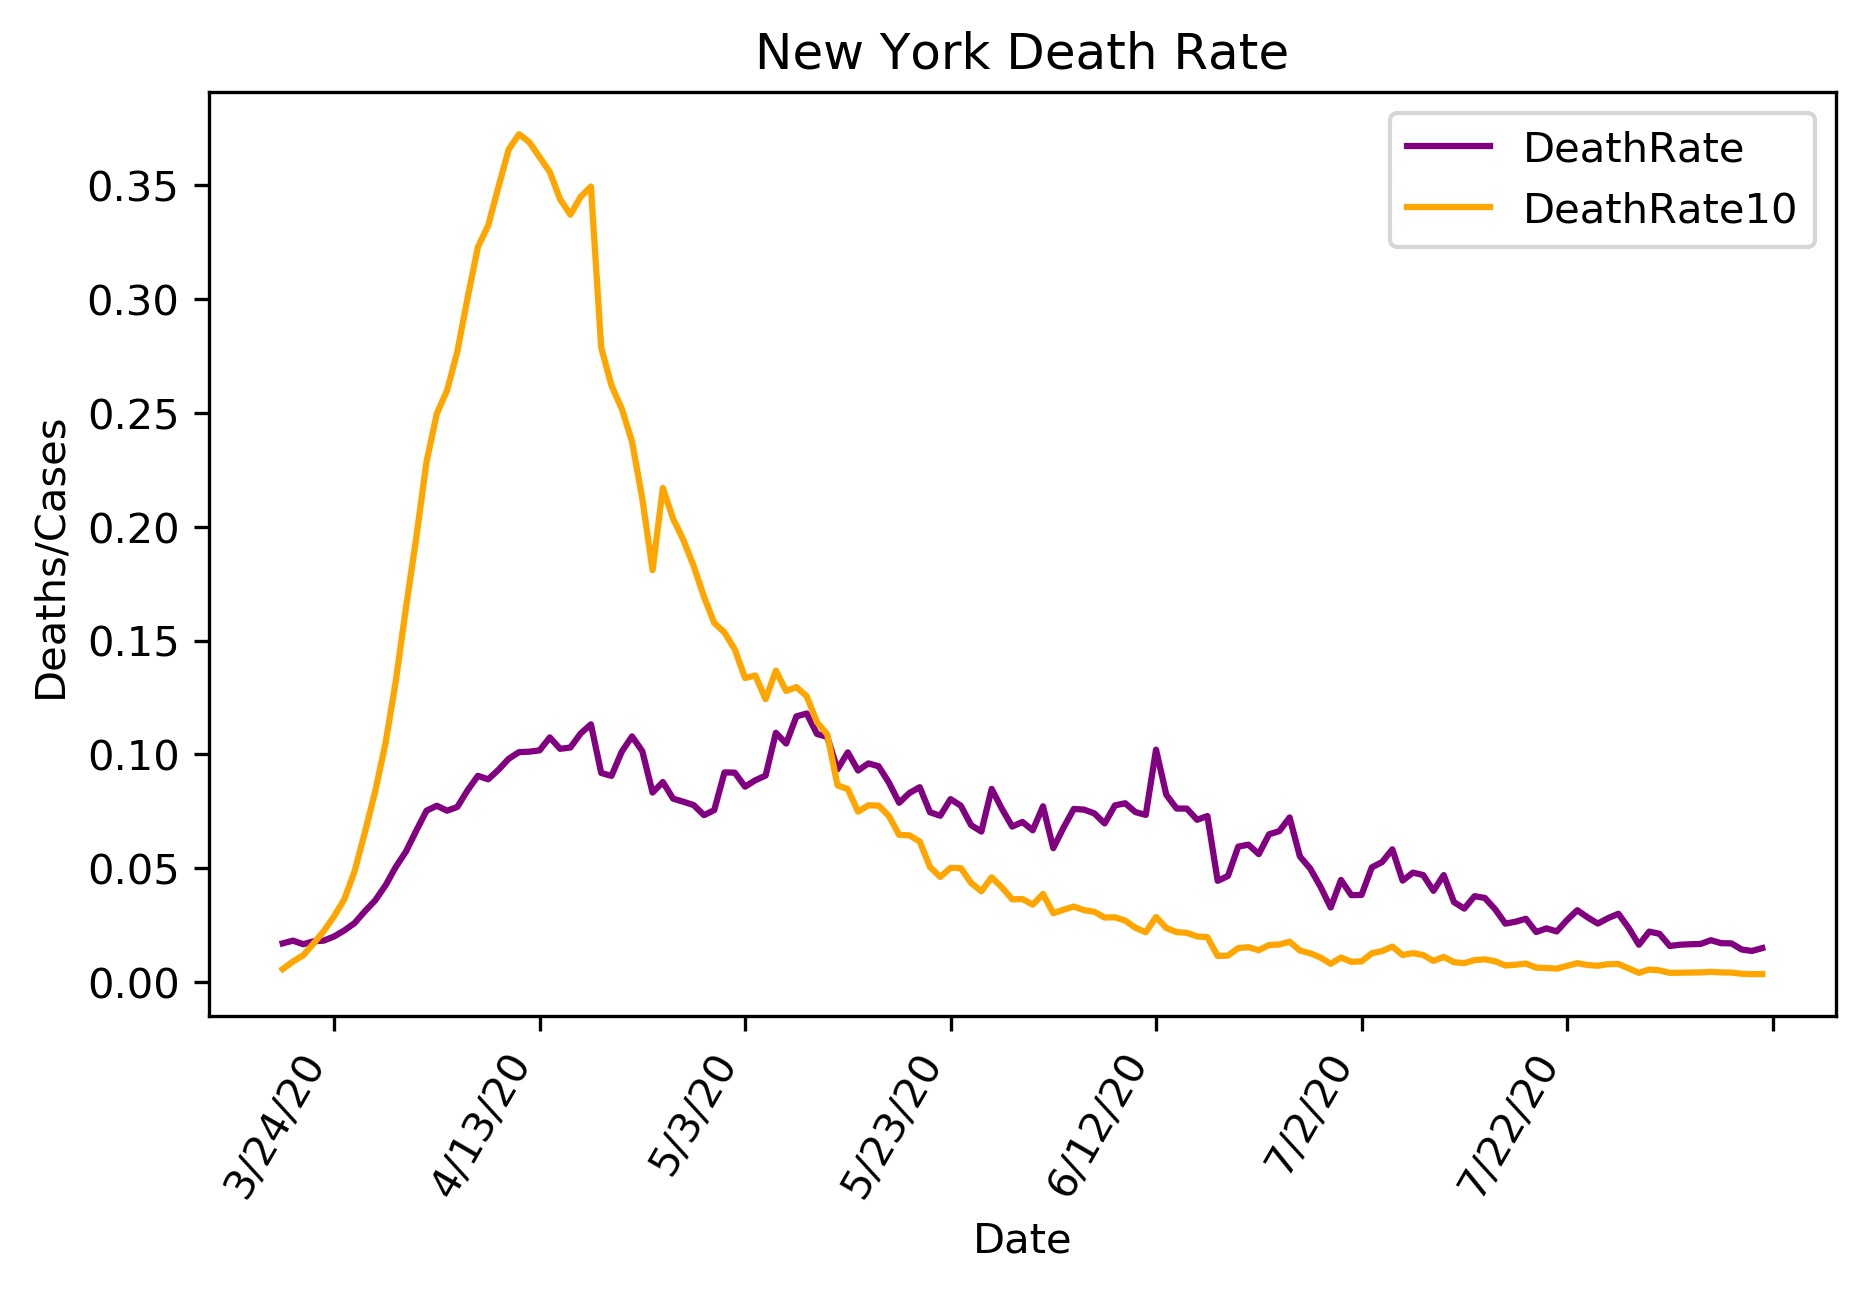
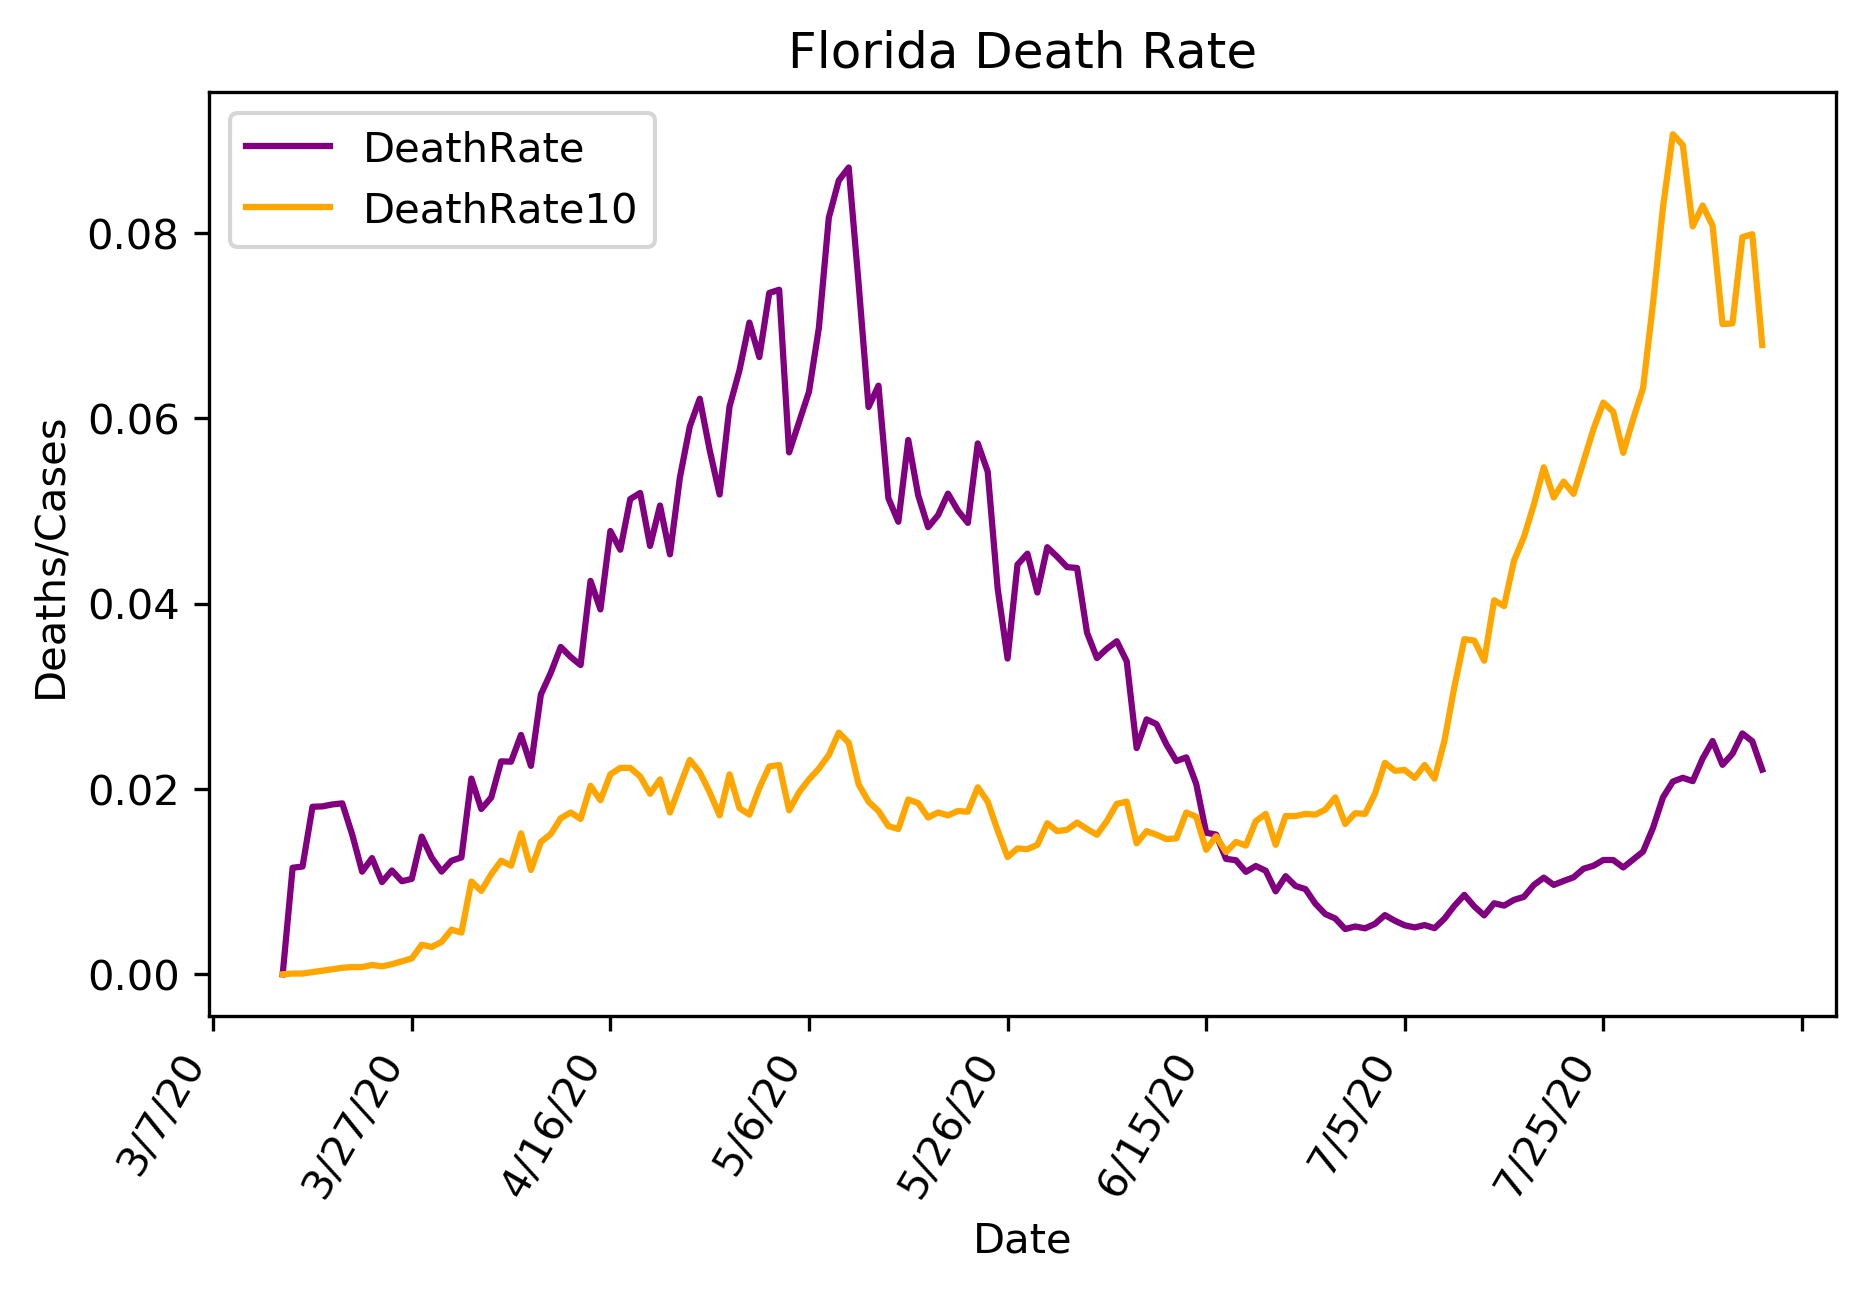
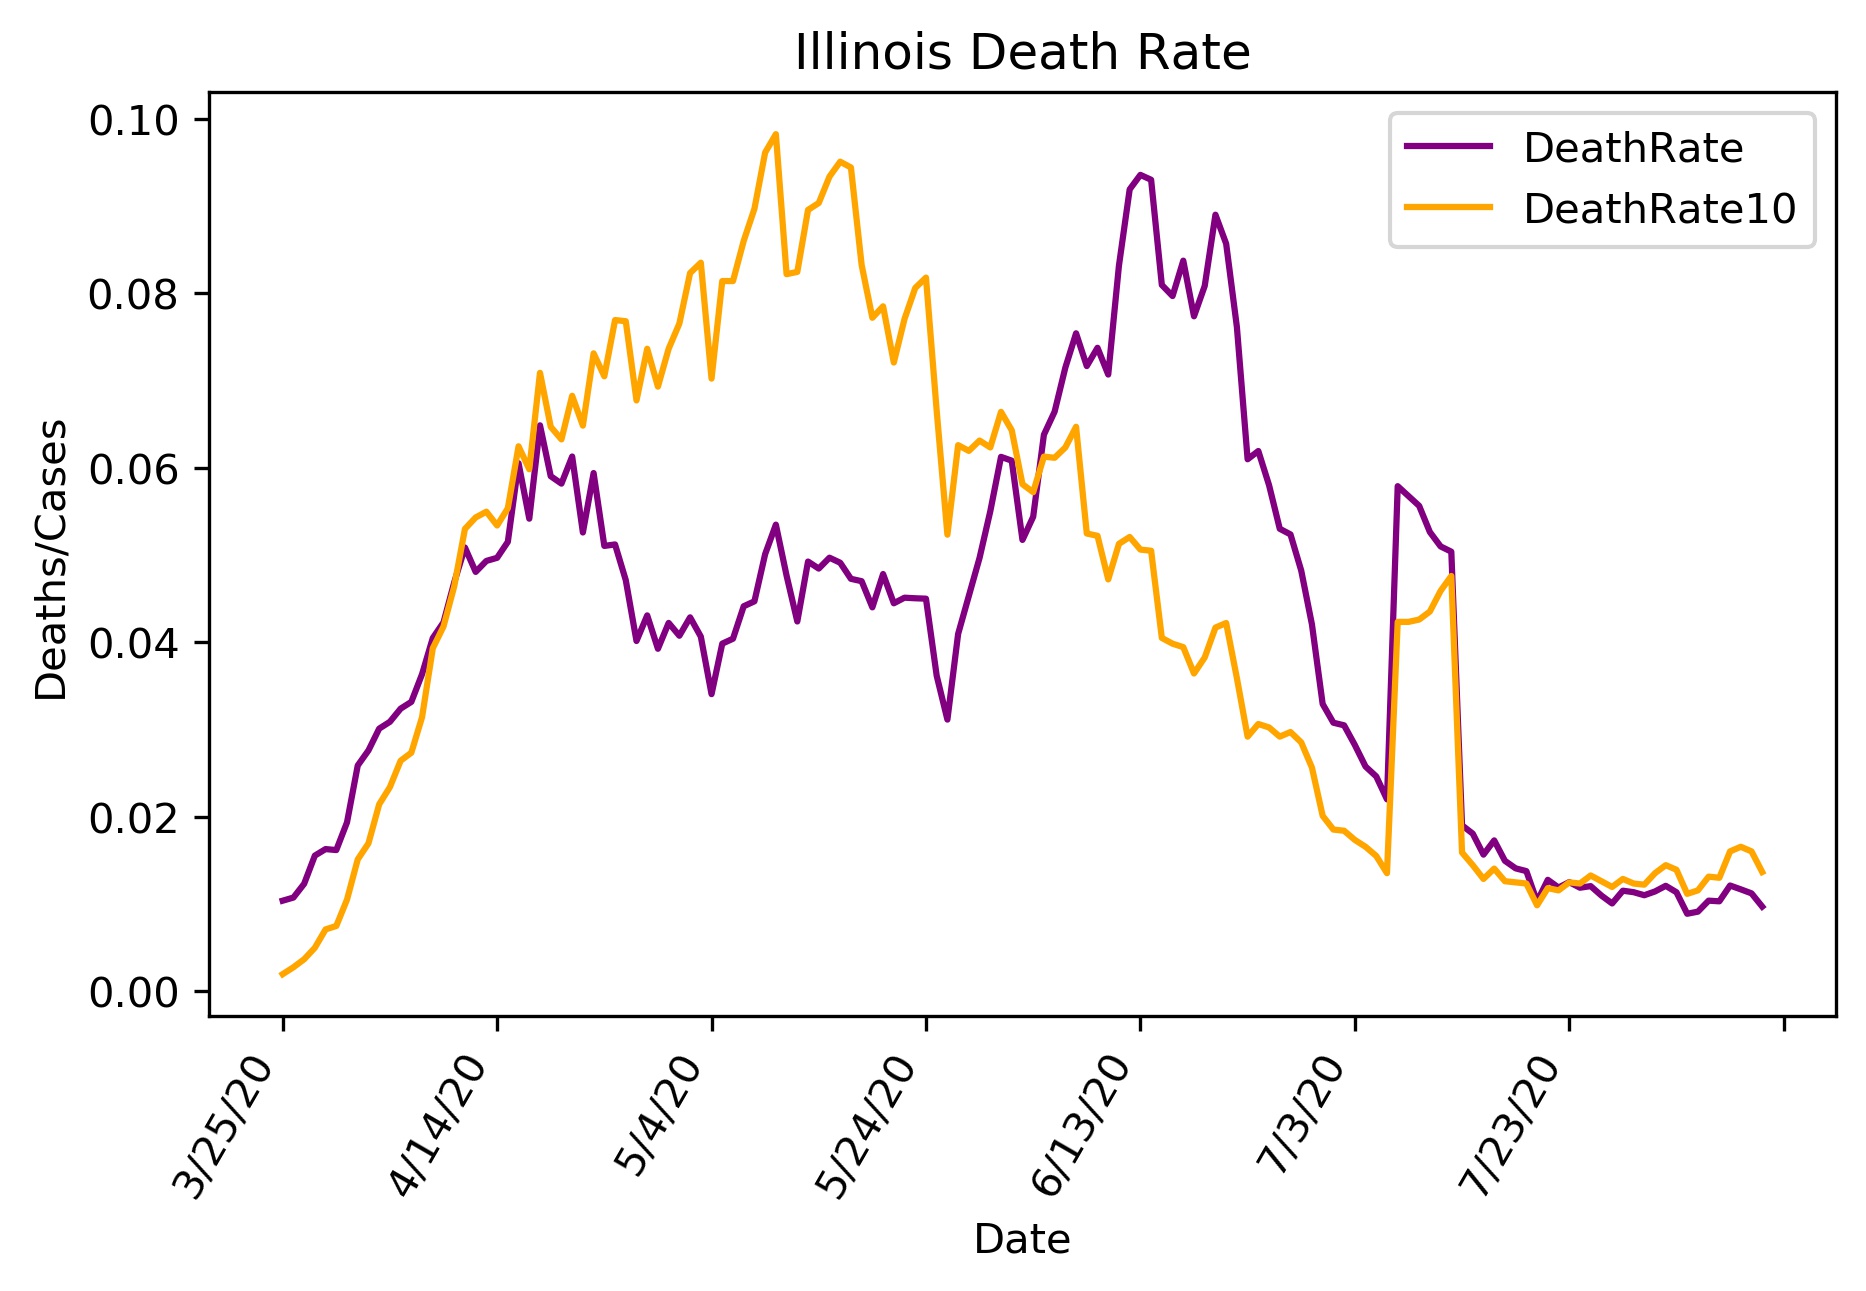
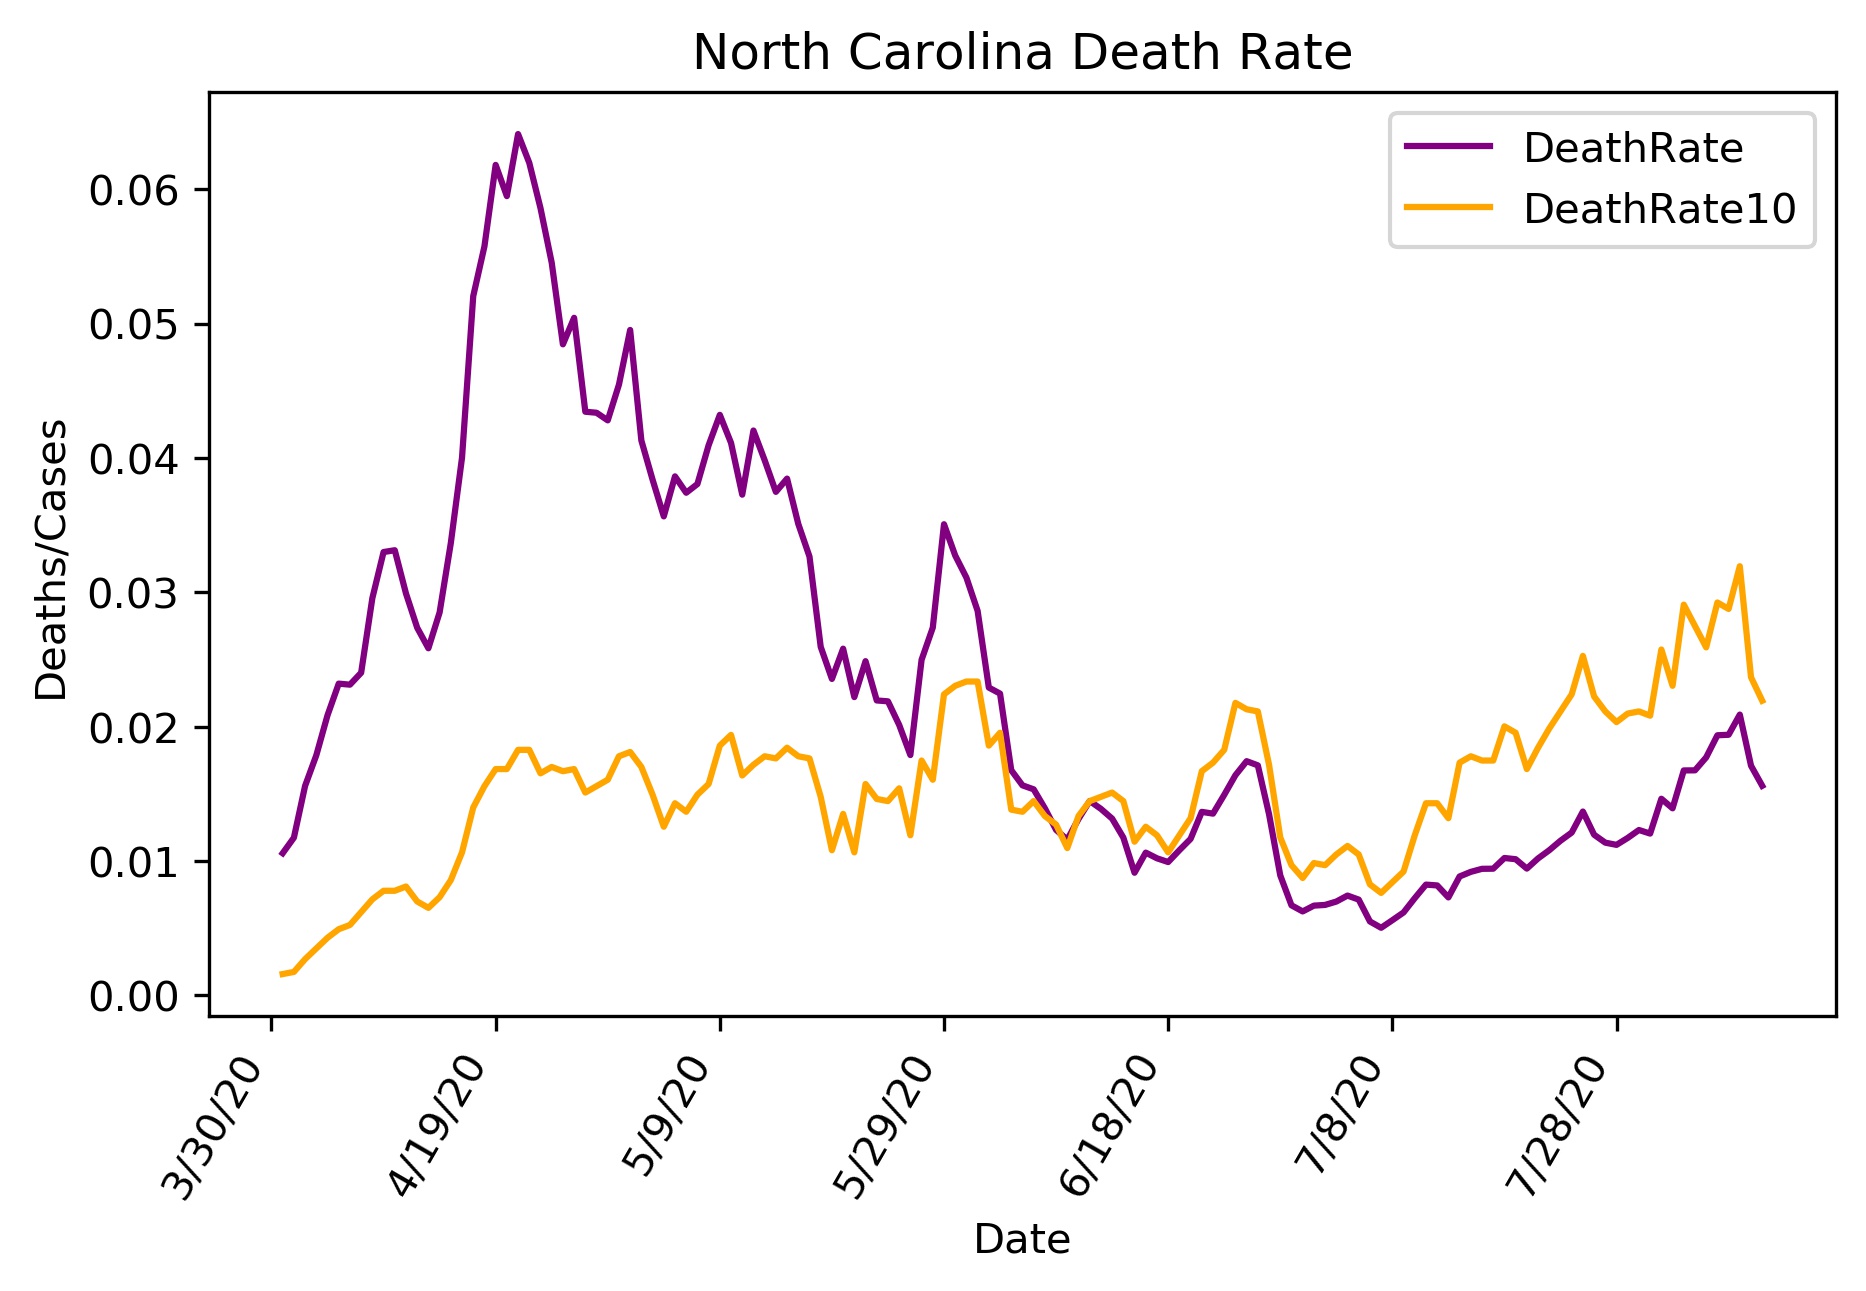
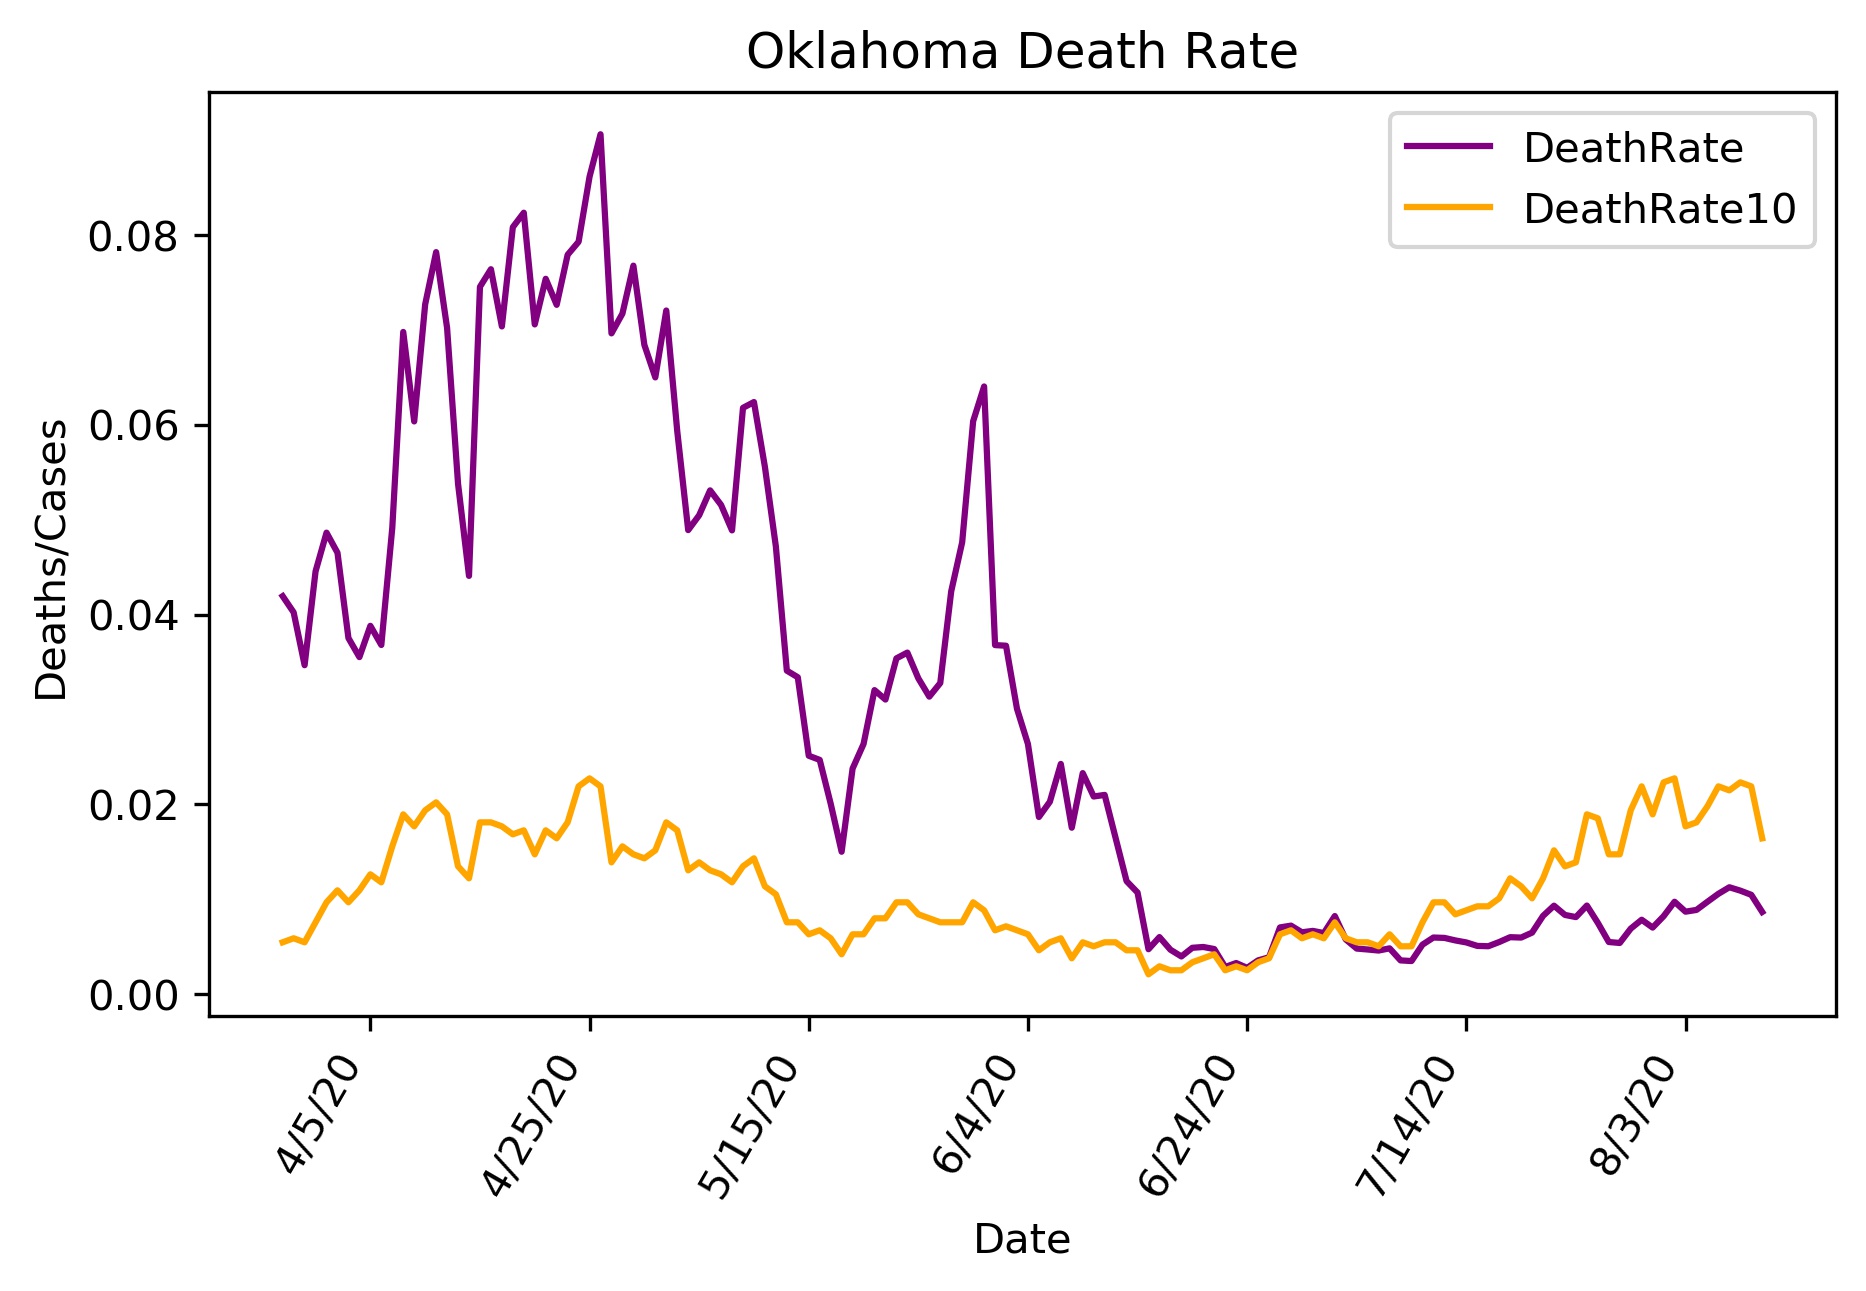
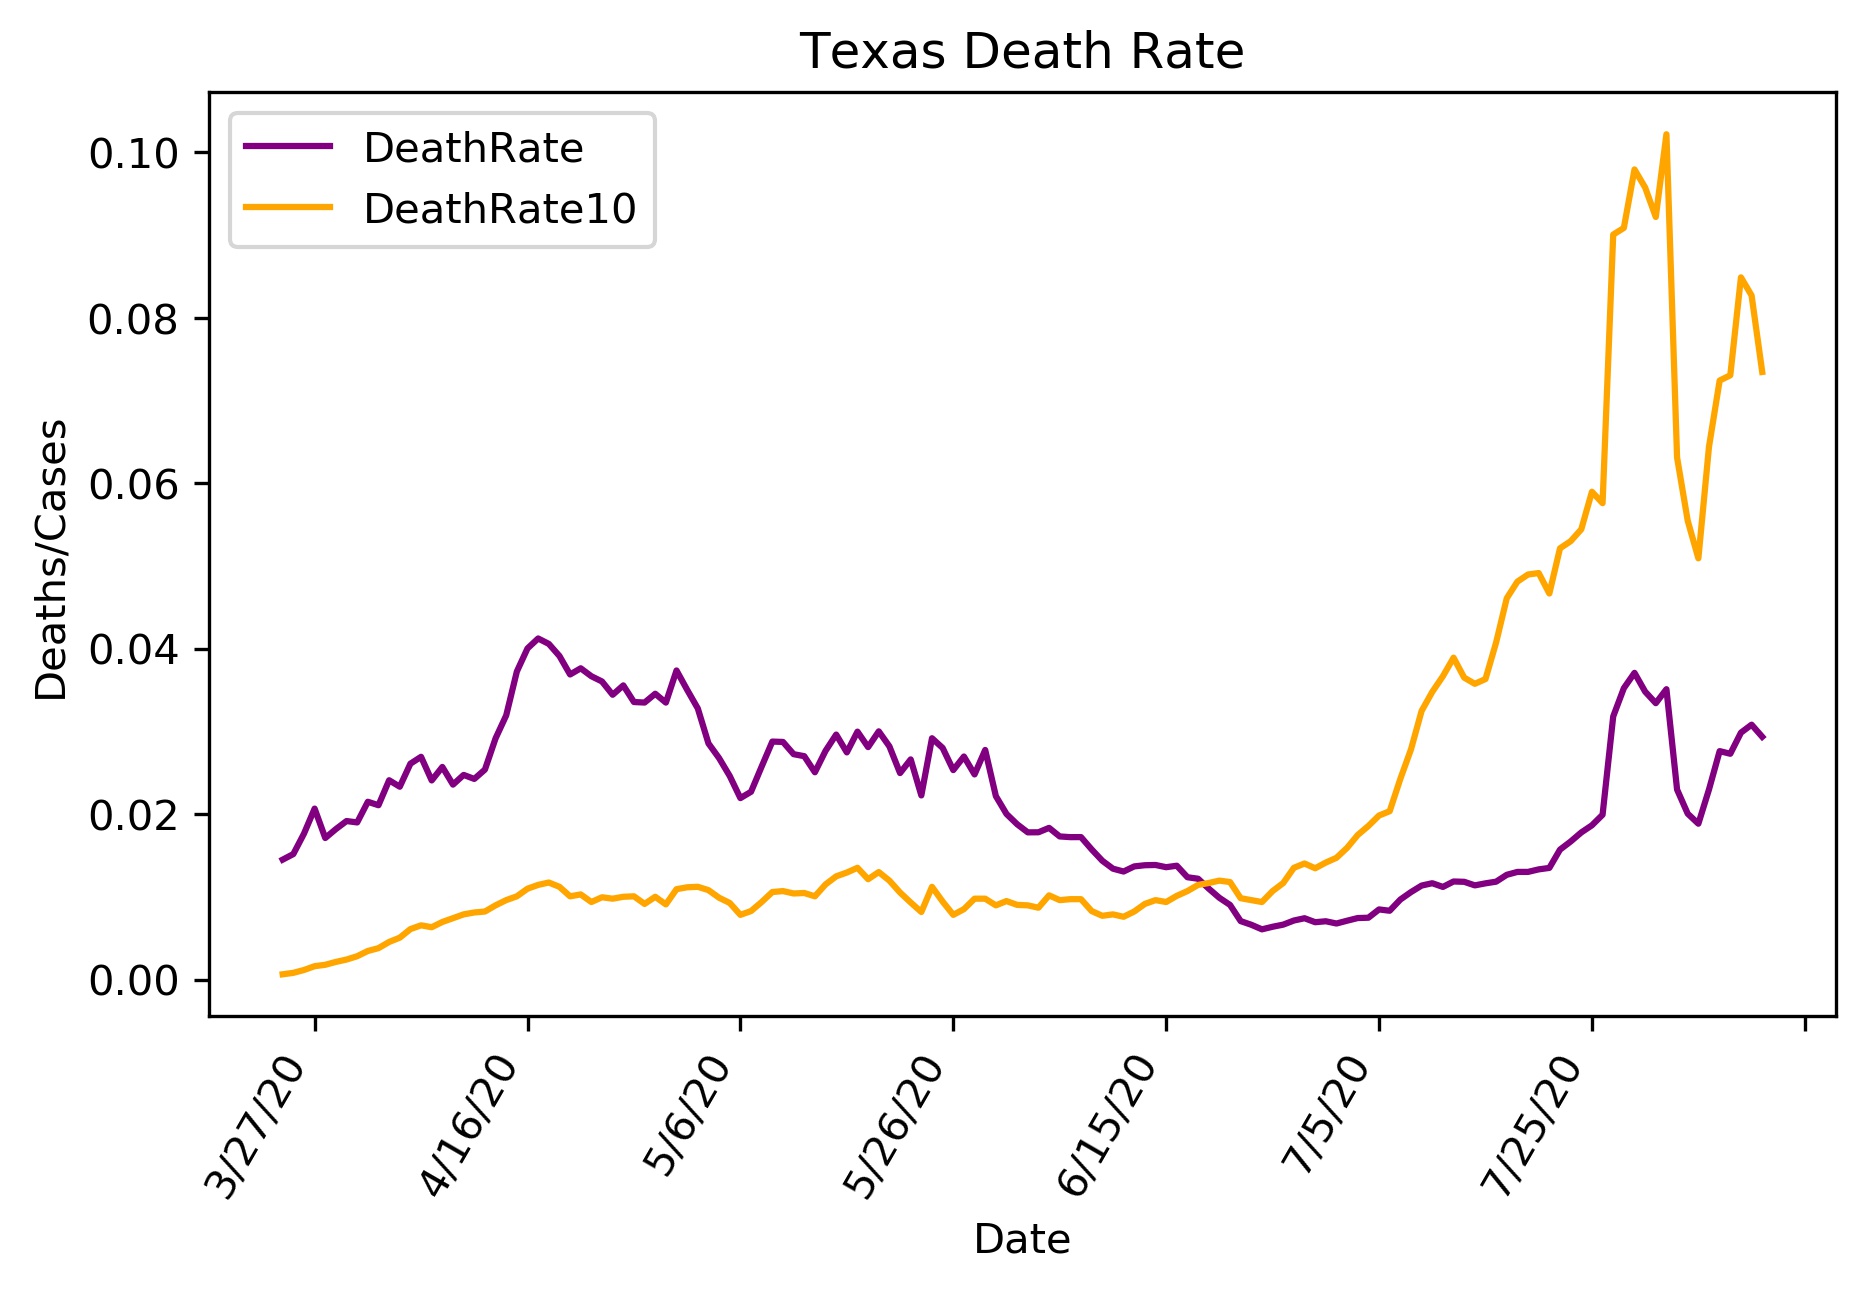
Death Rates. The purple line is Deaths/Cases. The orange line is Deaths/10,000 people. Both of these figures use the 5 day running average data.
Summary Data
Cases
Deaths
Rate
Detailed Data
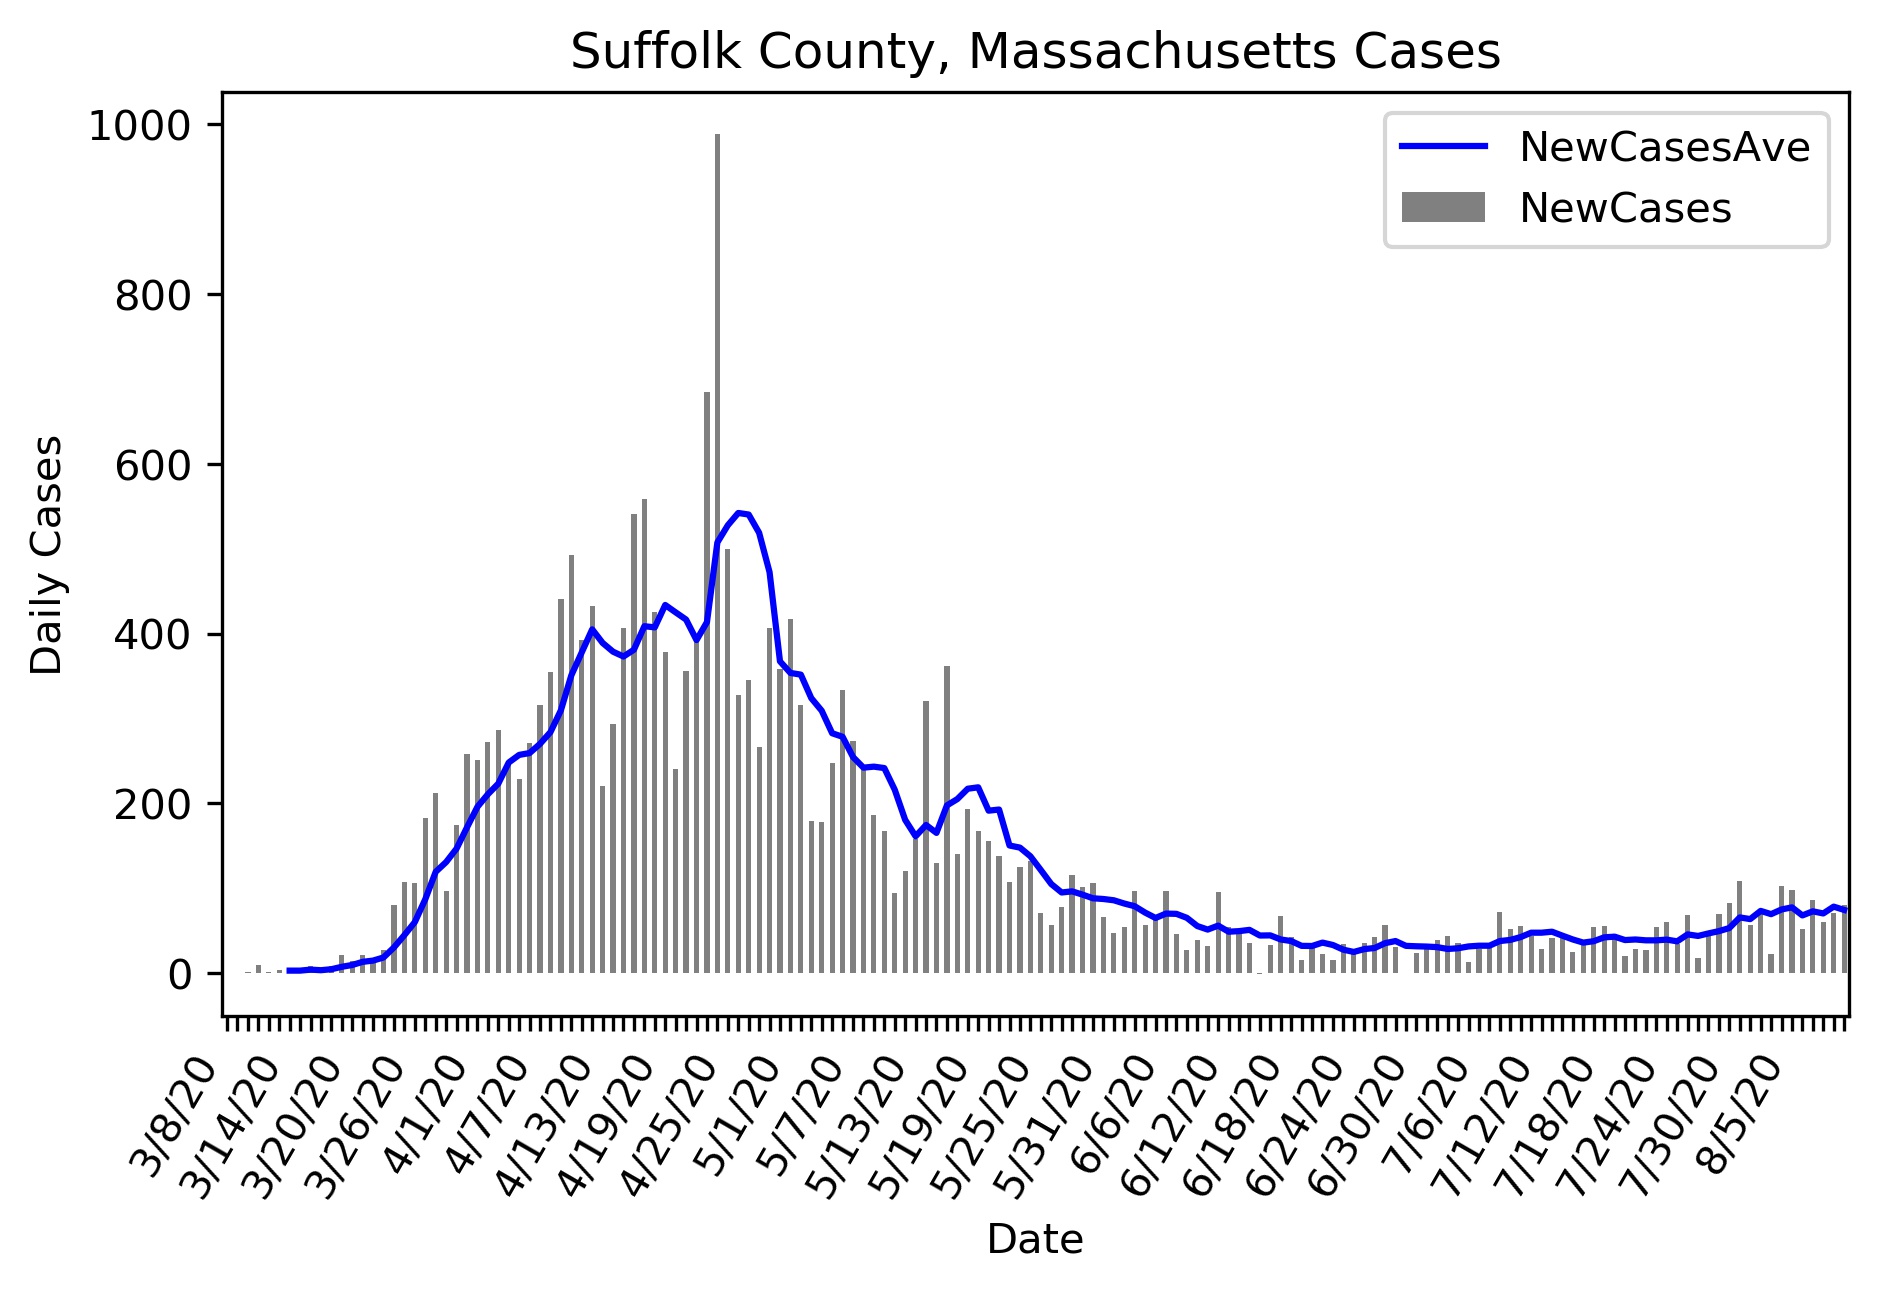
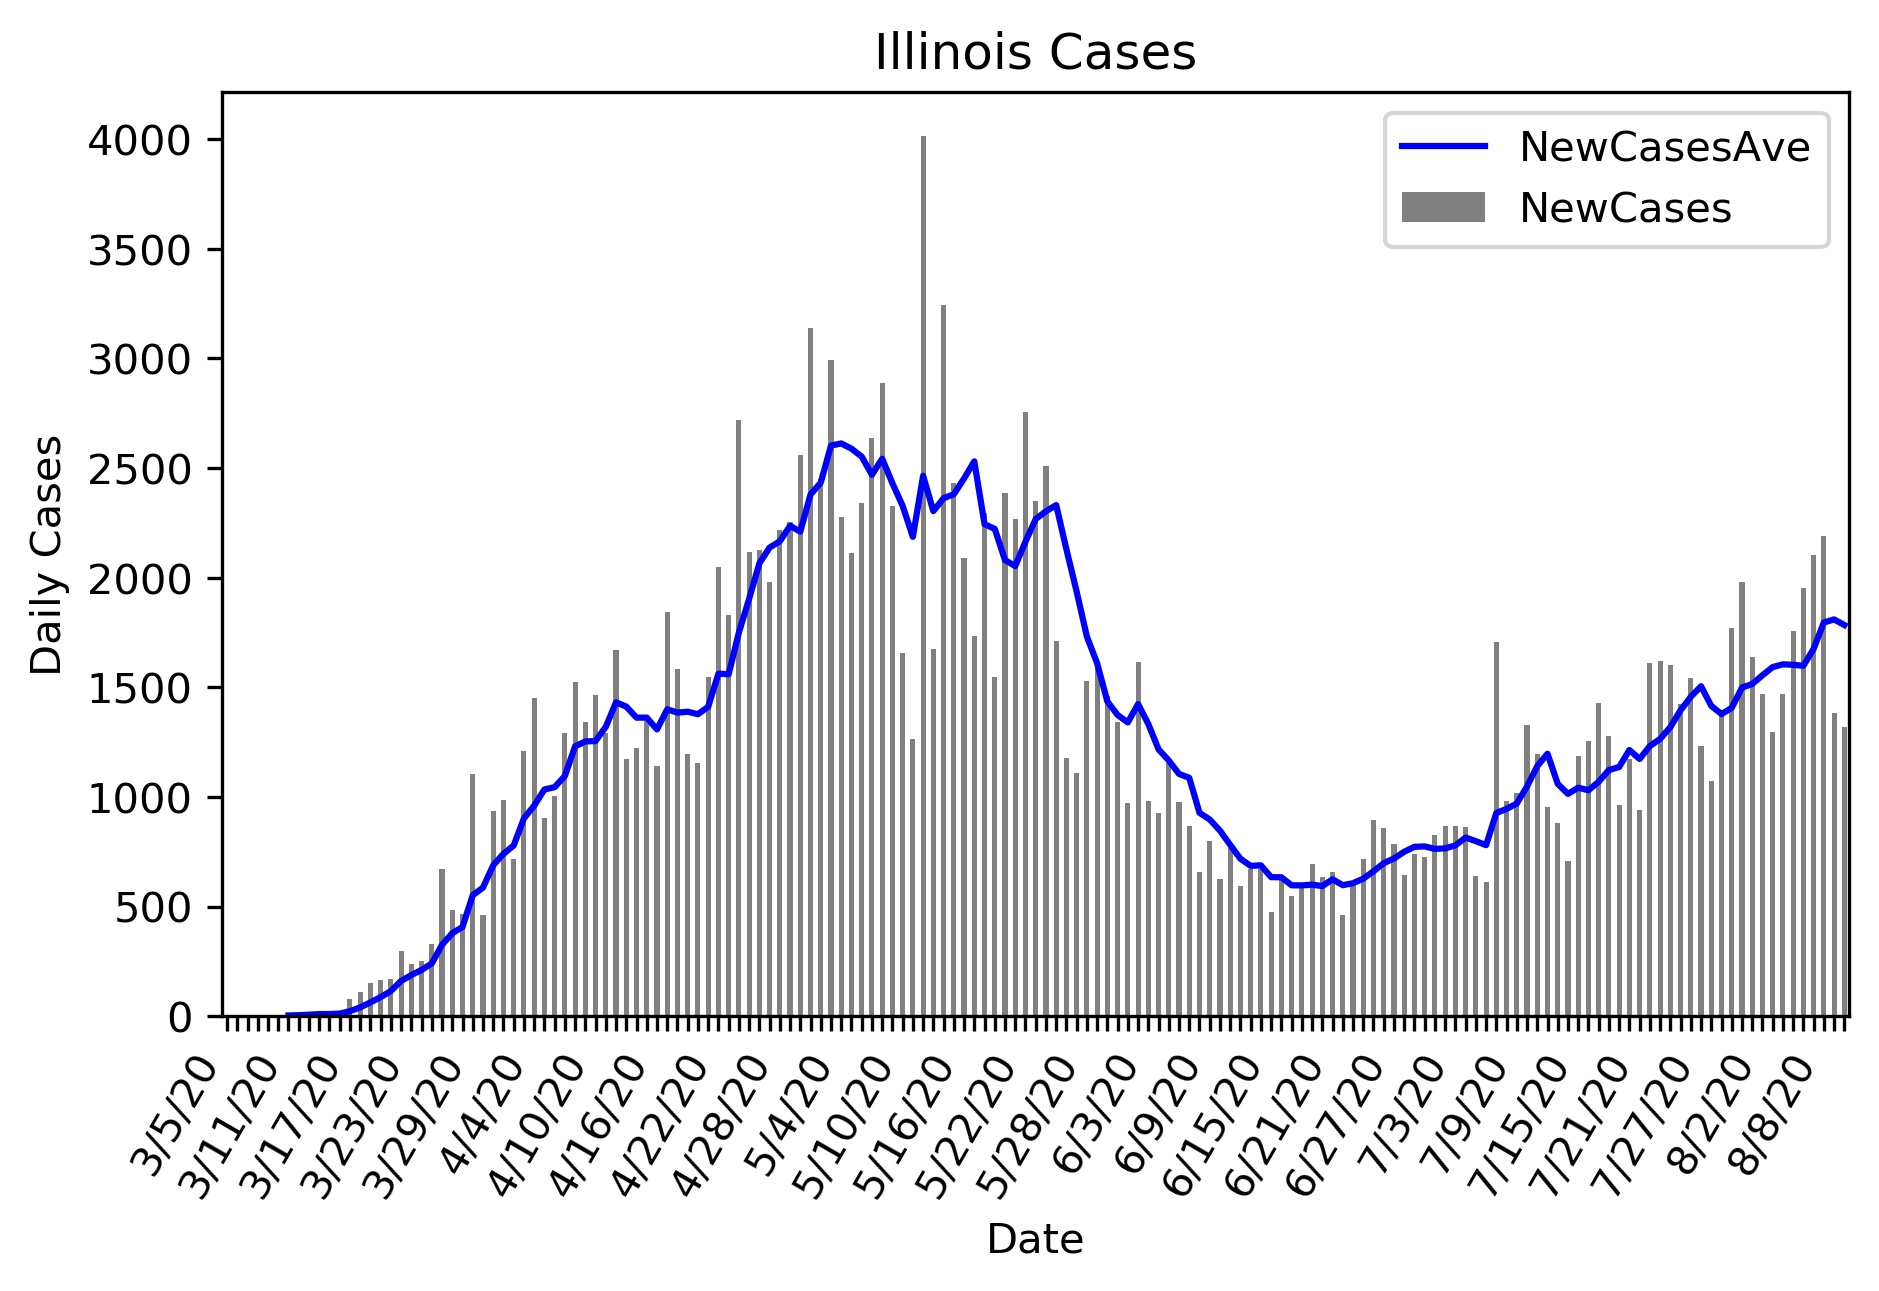
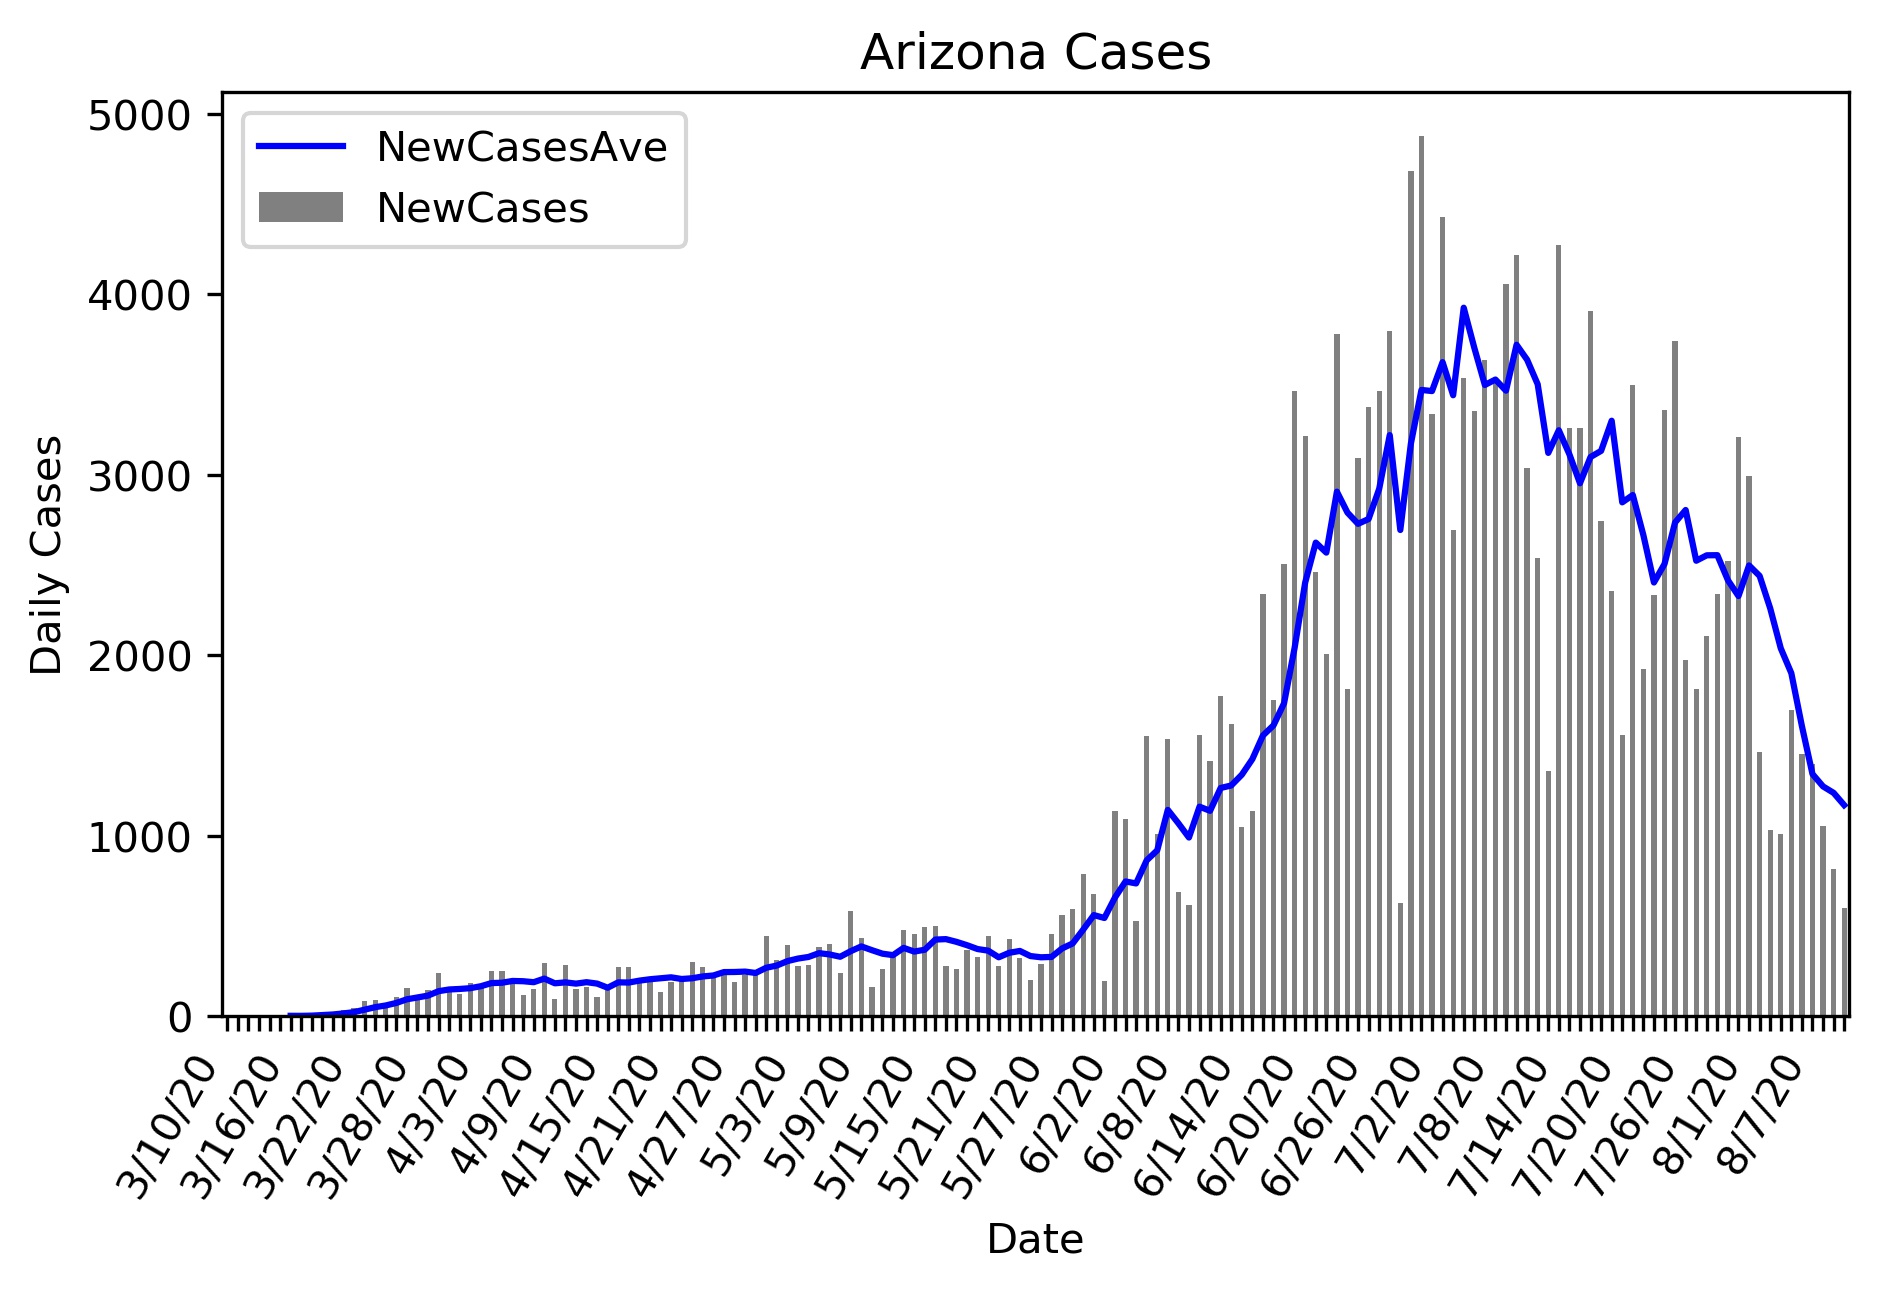
Cases per day. The line is a 5 day running average.
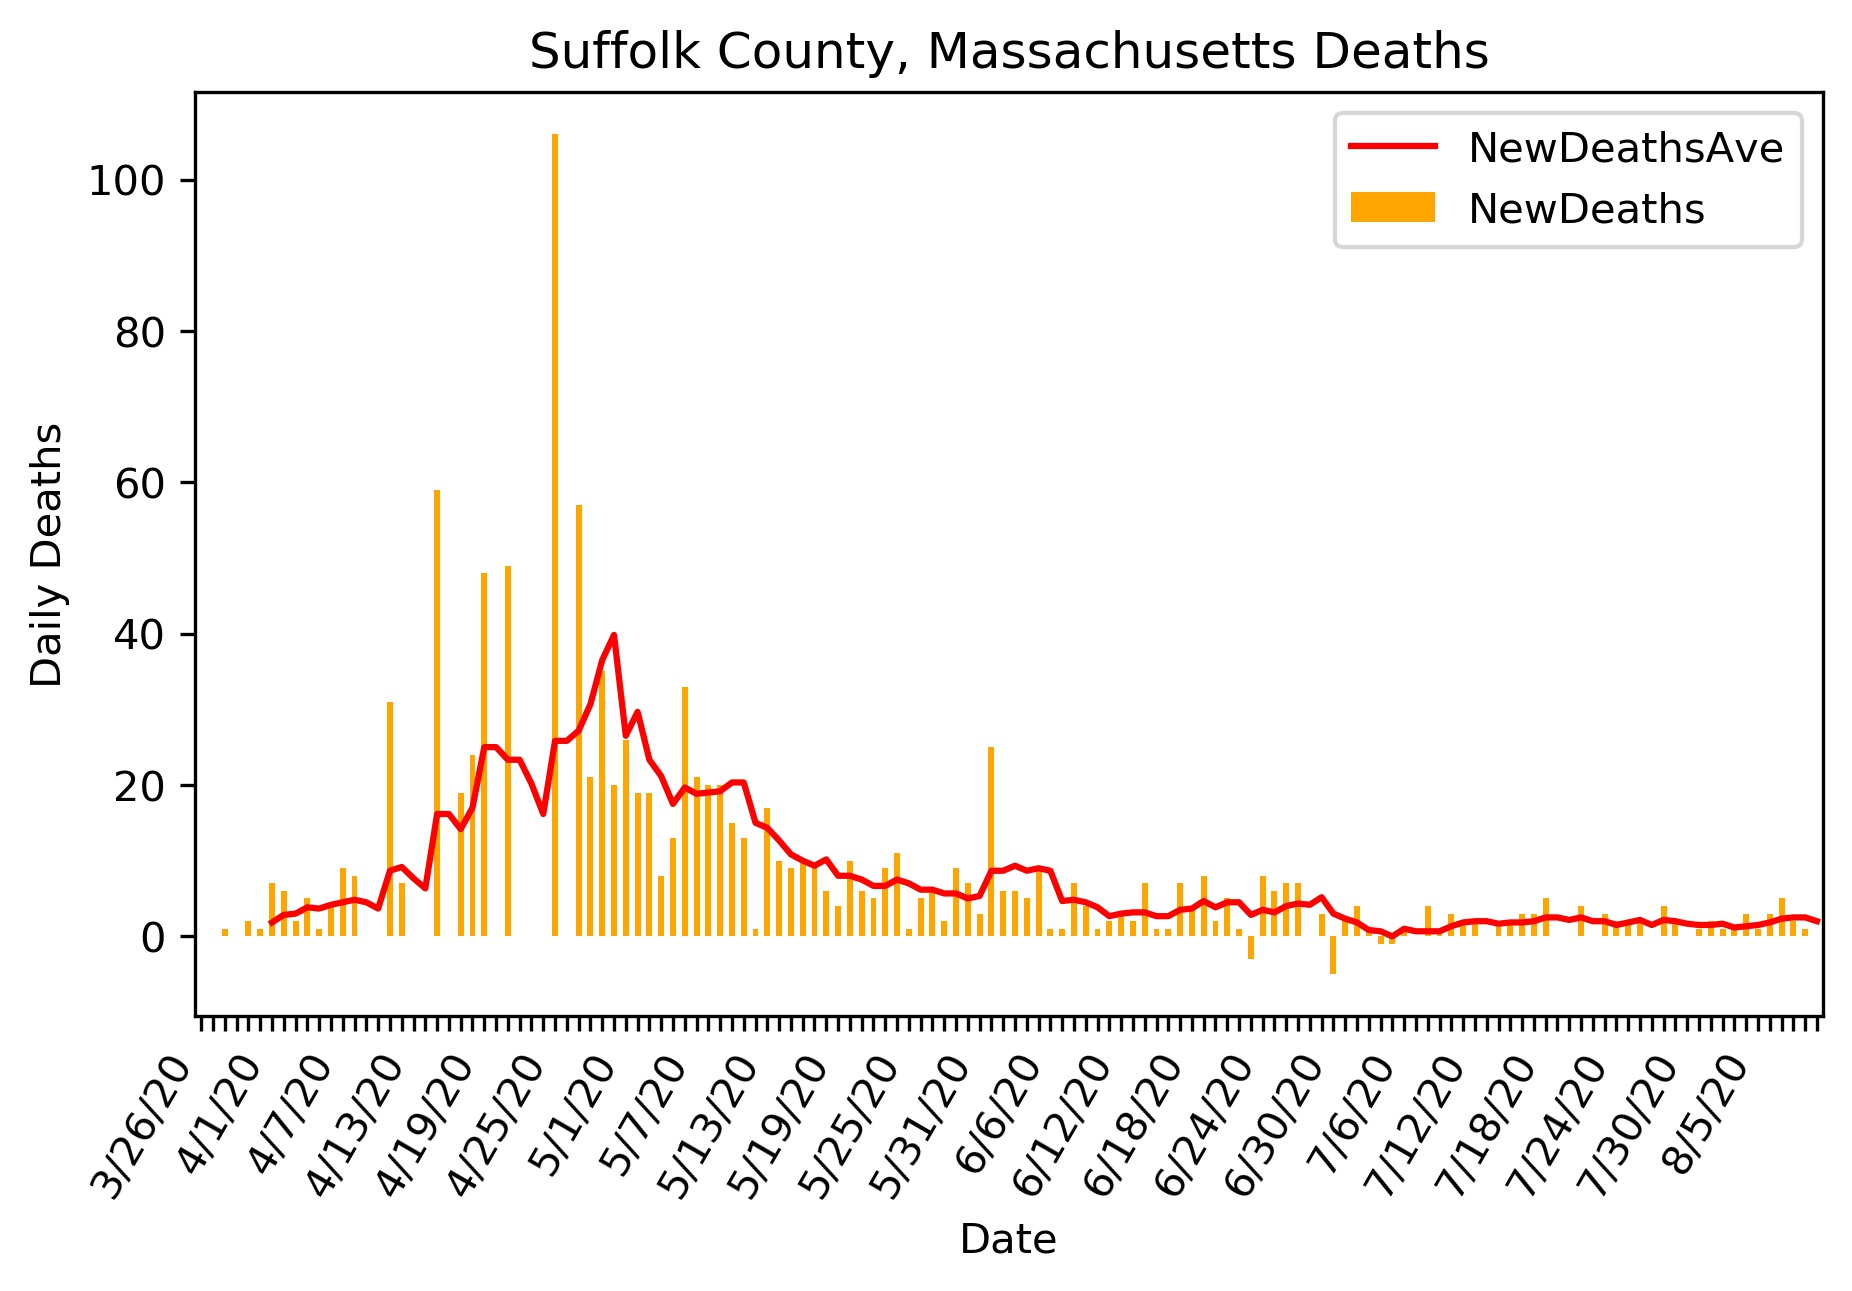
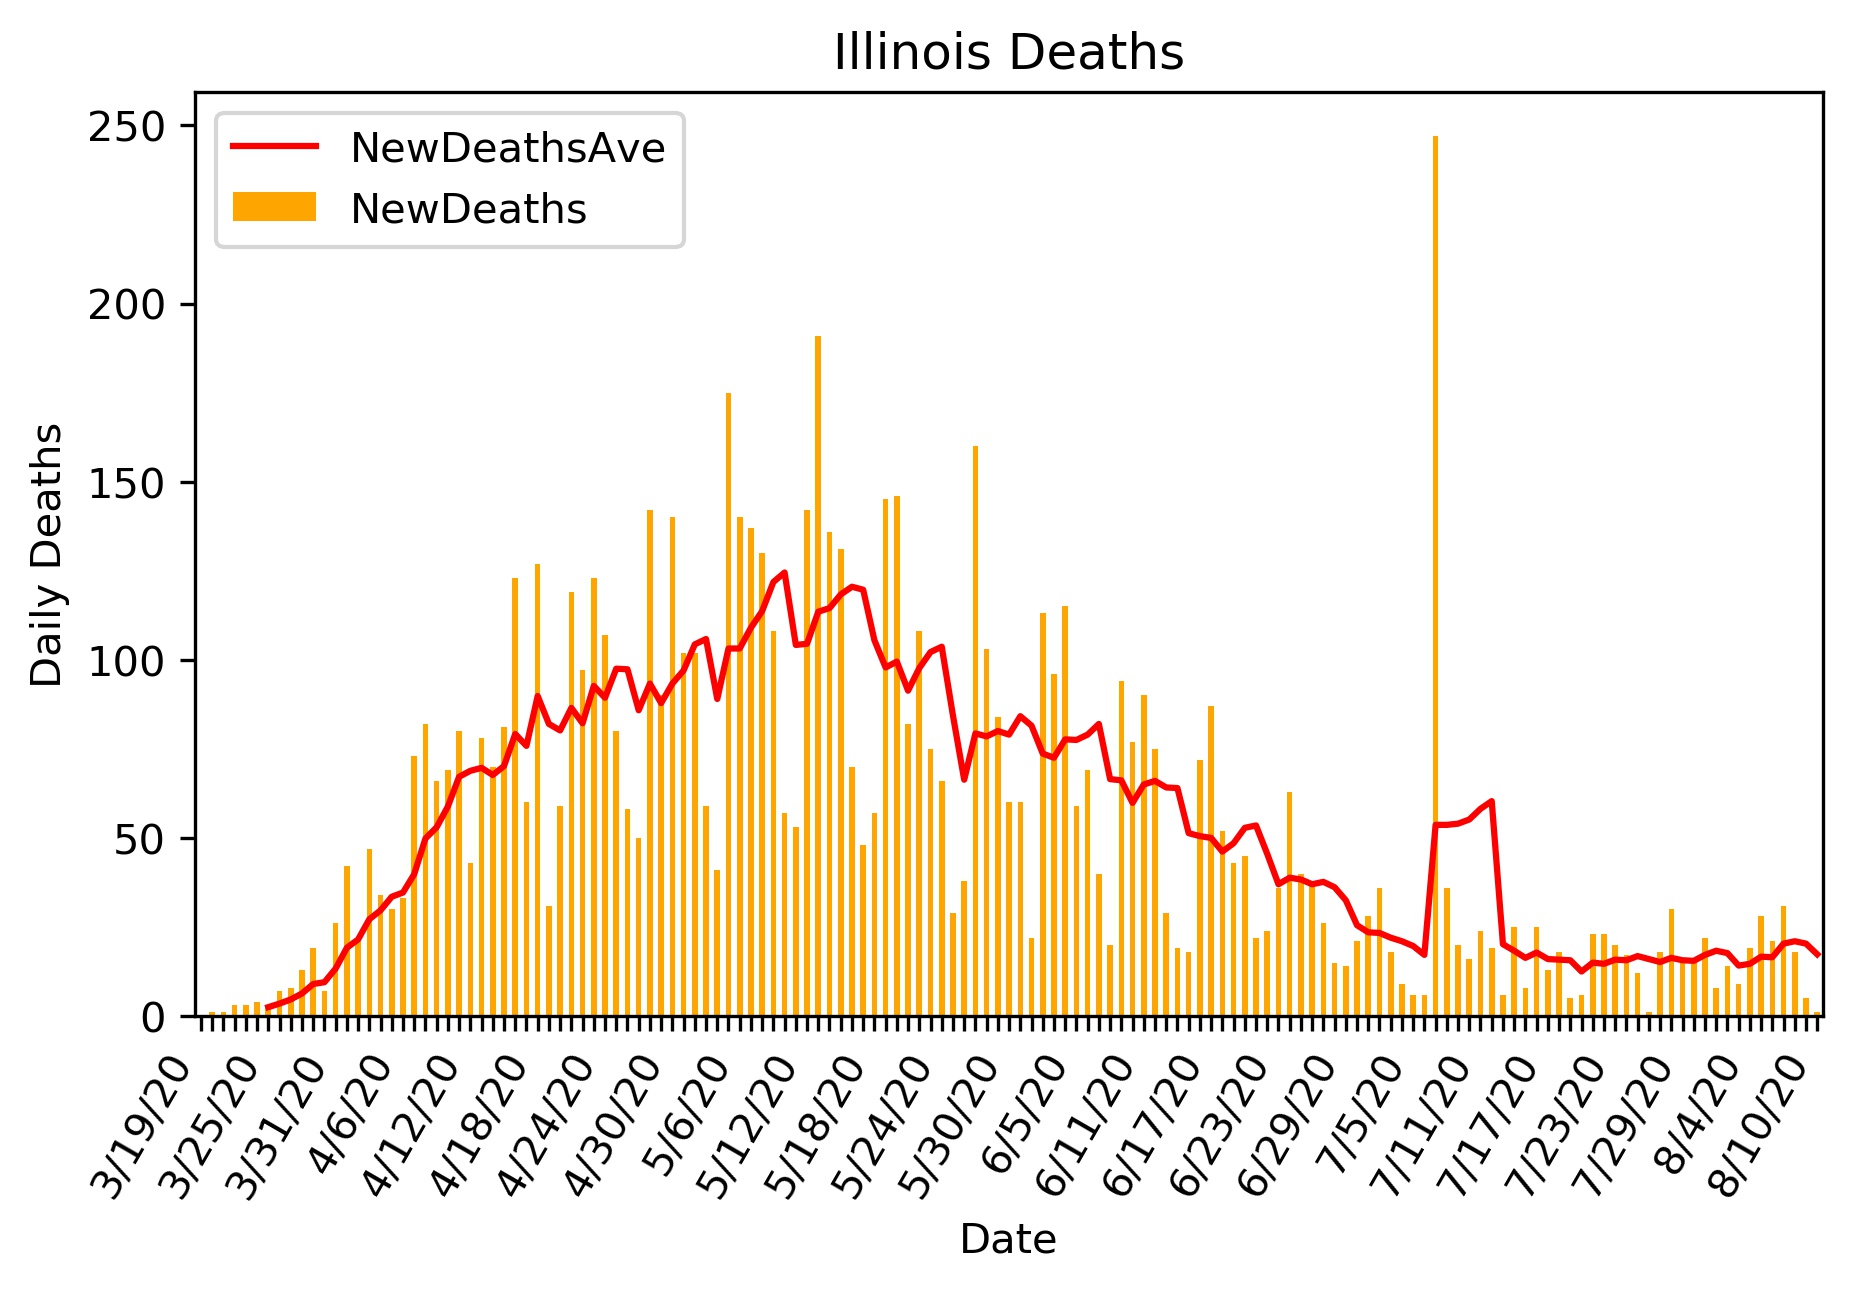
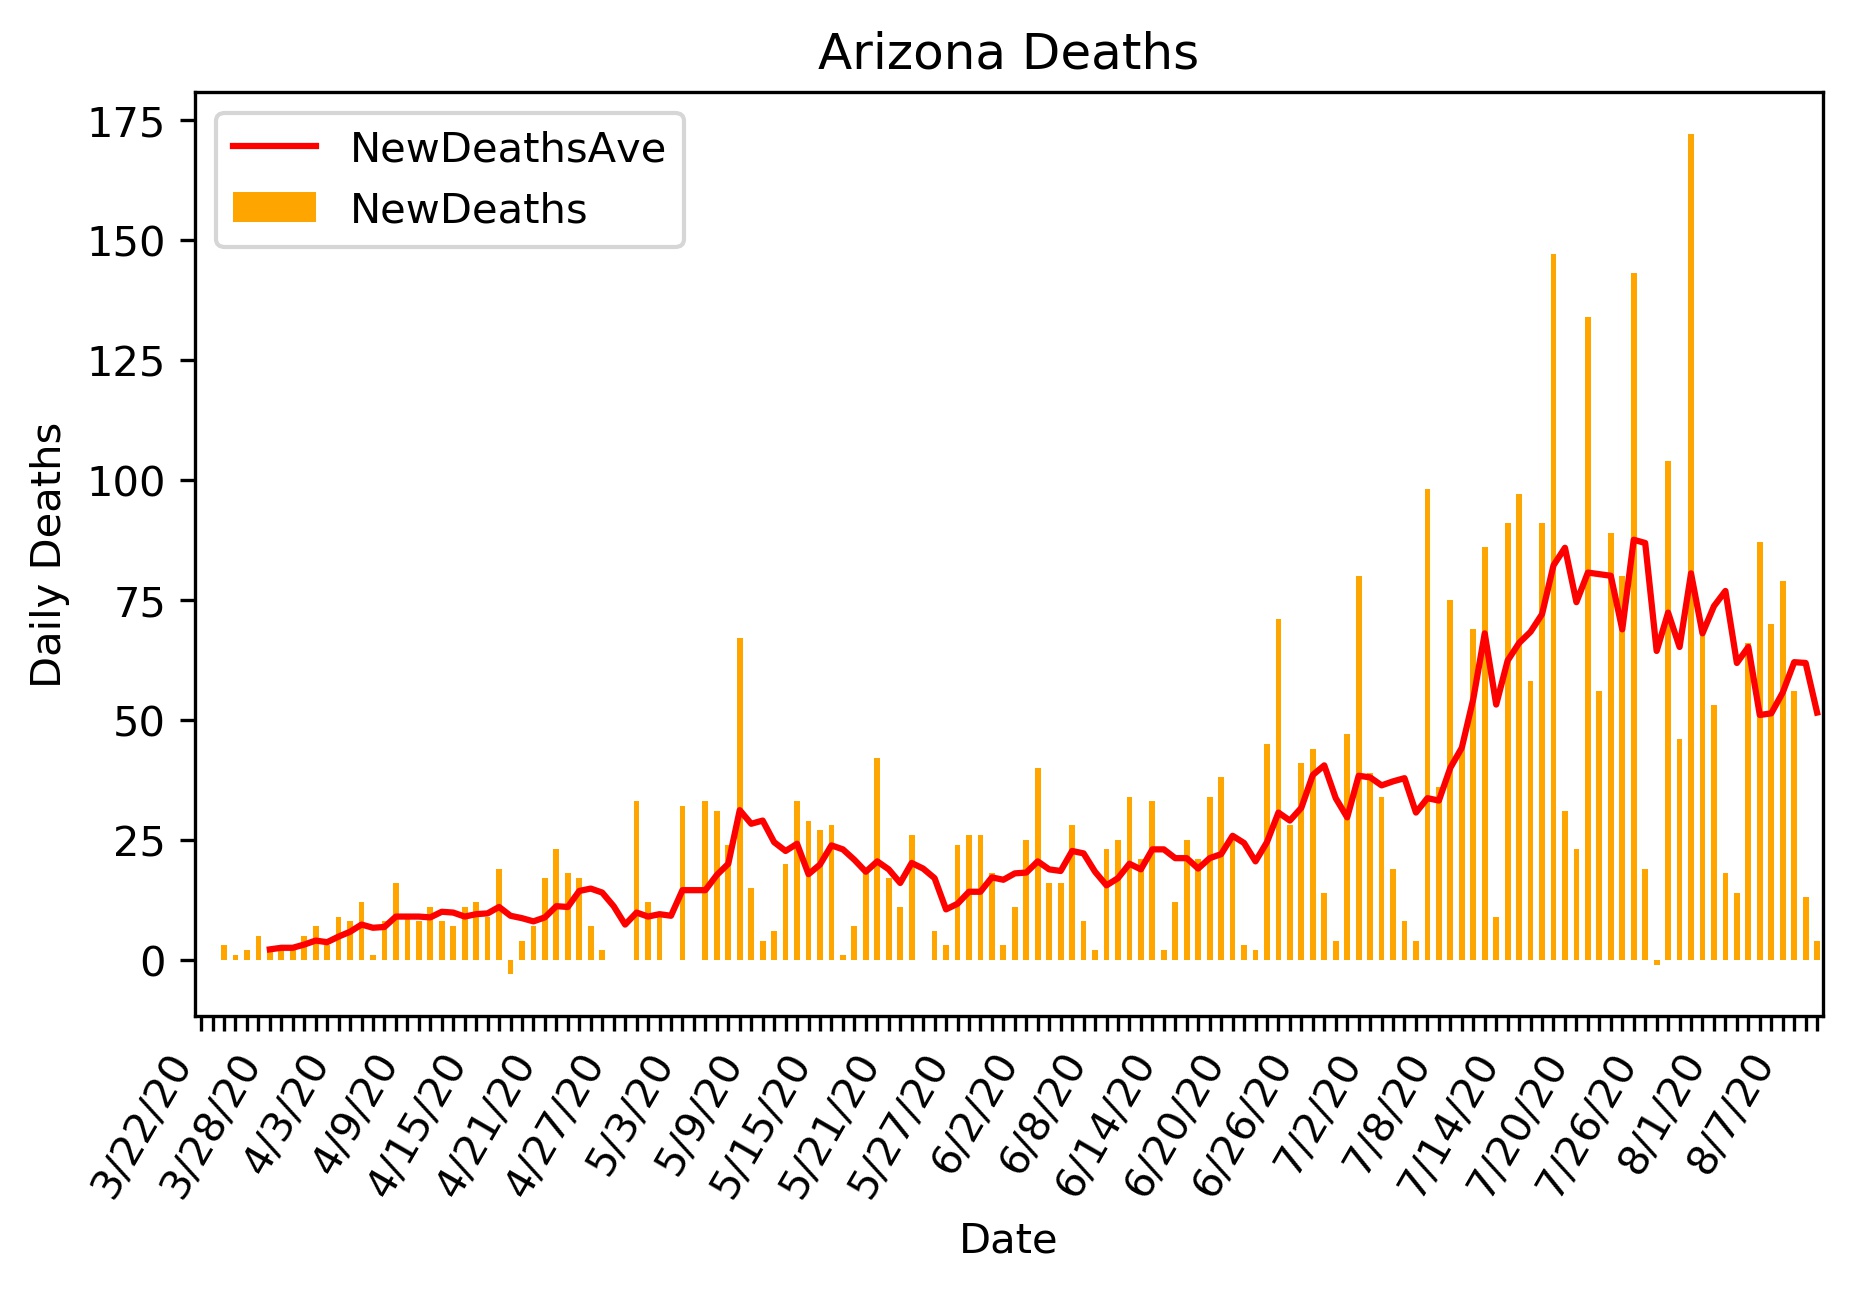
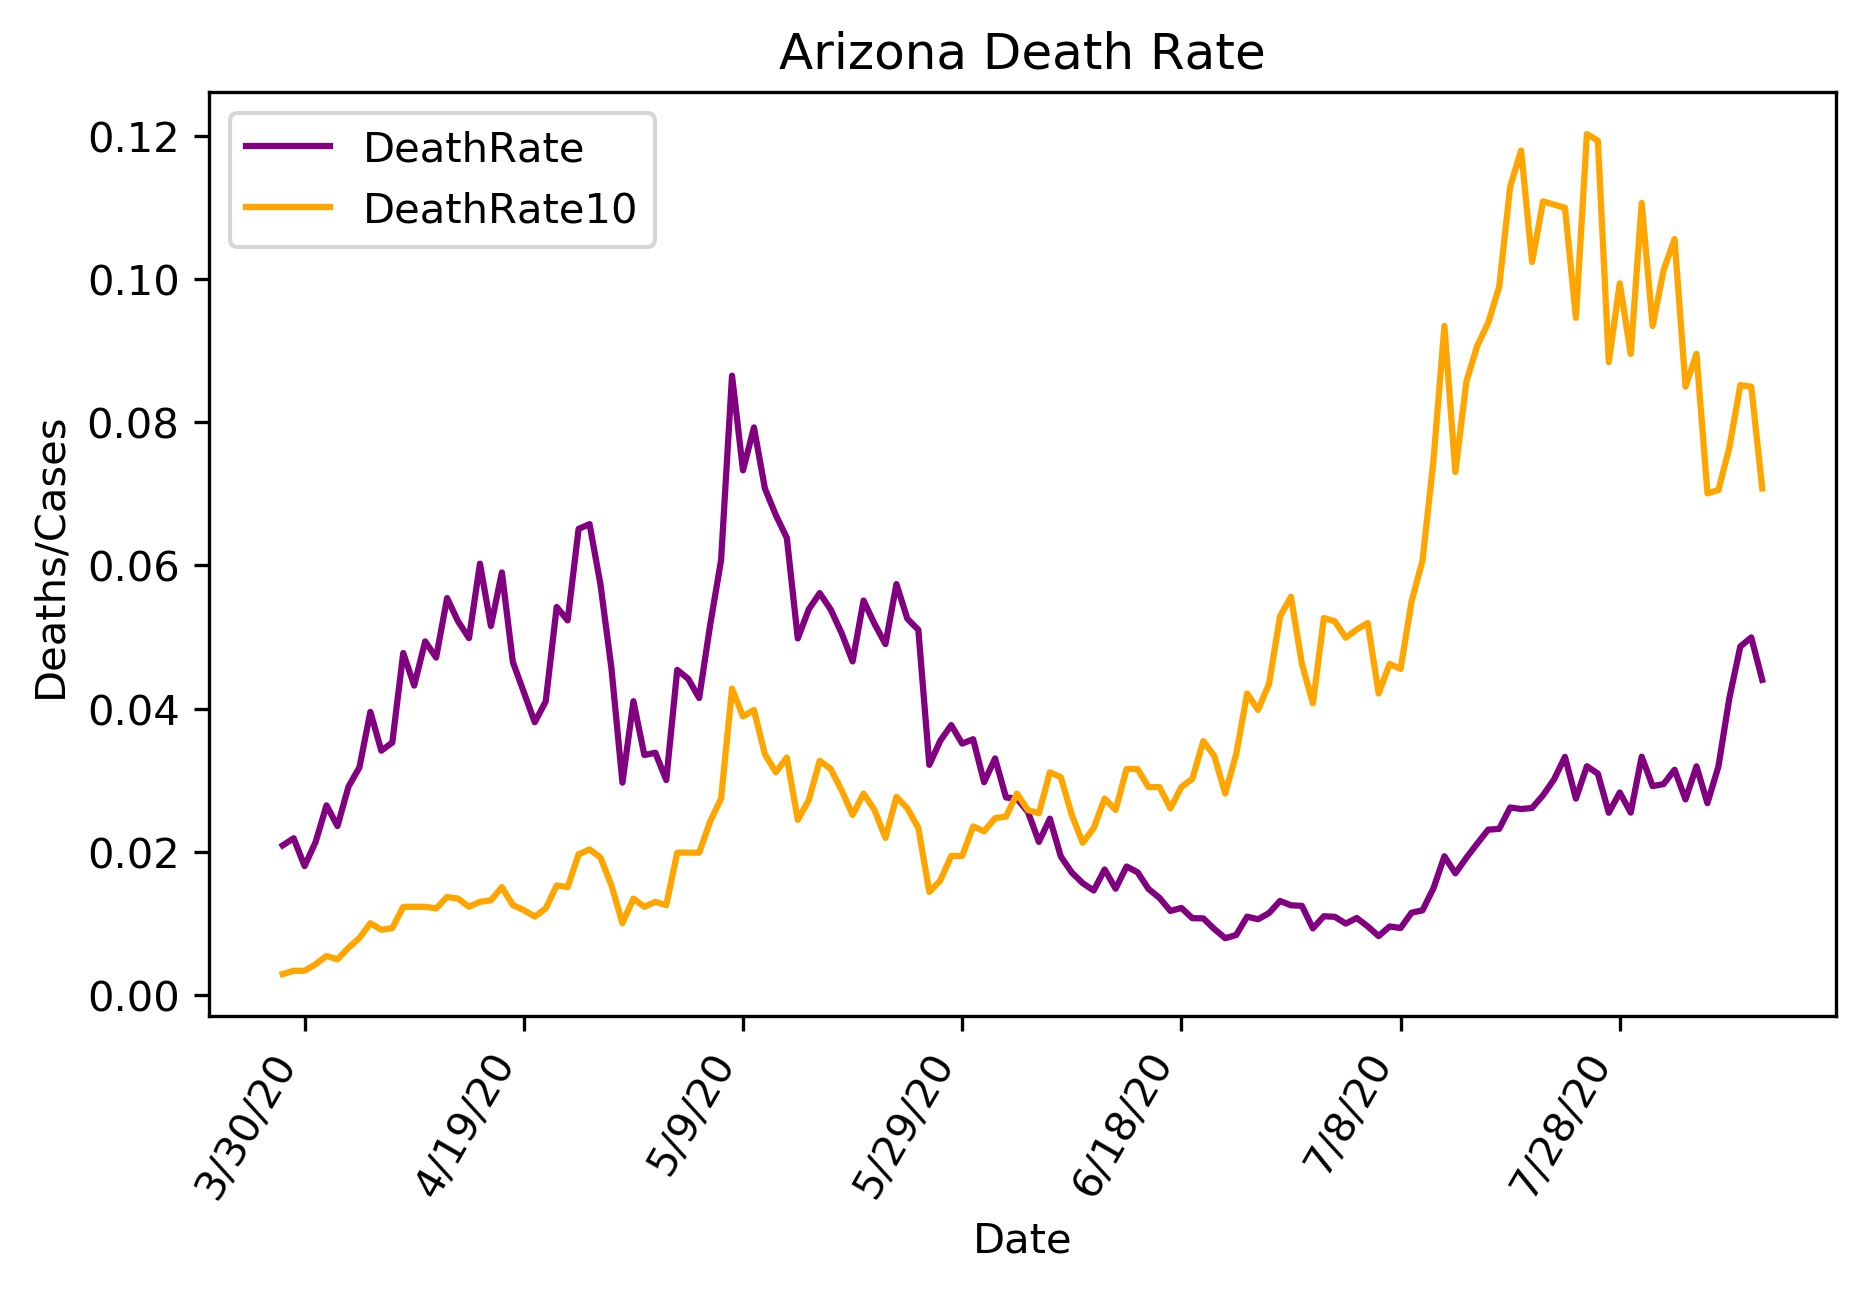
Deaths per day. The line is a 5 day running average. Death Rates. The purple line is Deaths/Cases. The orange line is Deaths/10,000 people. Both of these figures use the 5 day running average data.
Cases per day. The line is a 5 day running average.
Deaths per day. The line is a 5 day running average. Death Rates. The purple line is Deaths/Cases. The orange line is Deaths/10,000 people. Both of these figures use the 5 day running average data.
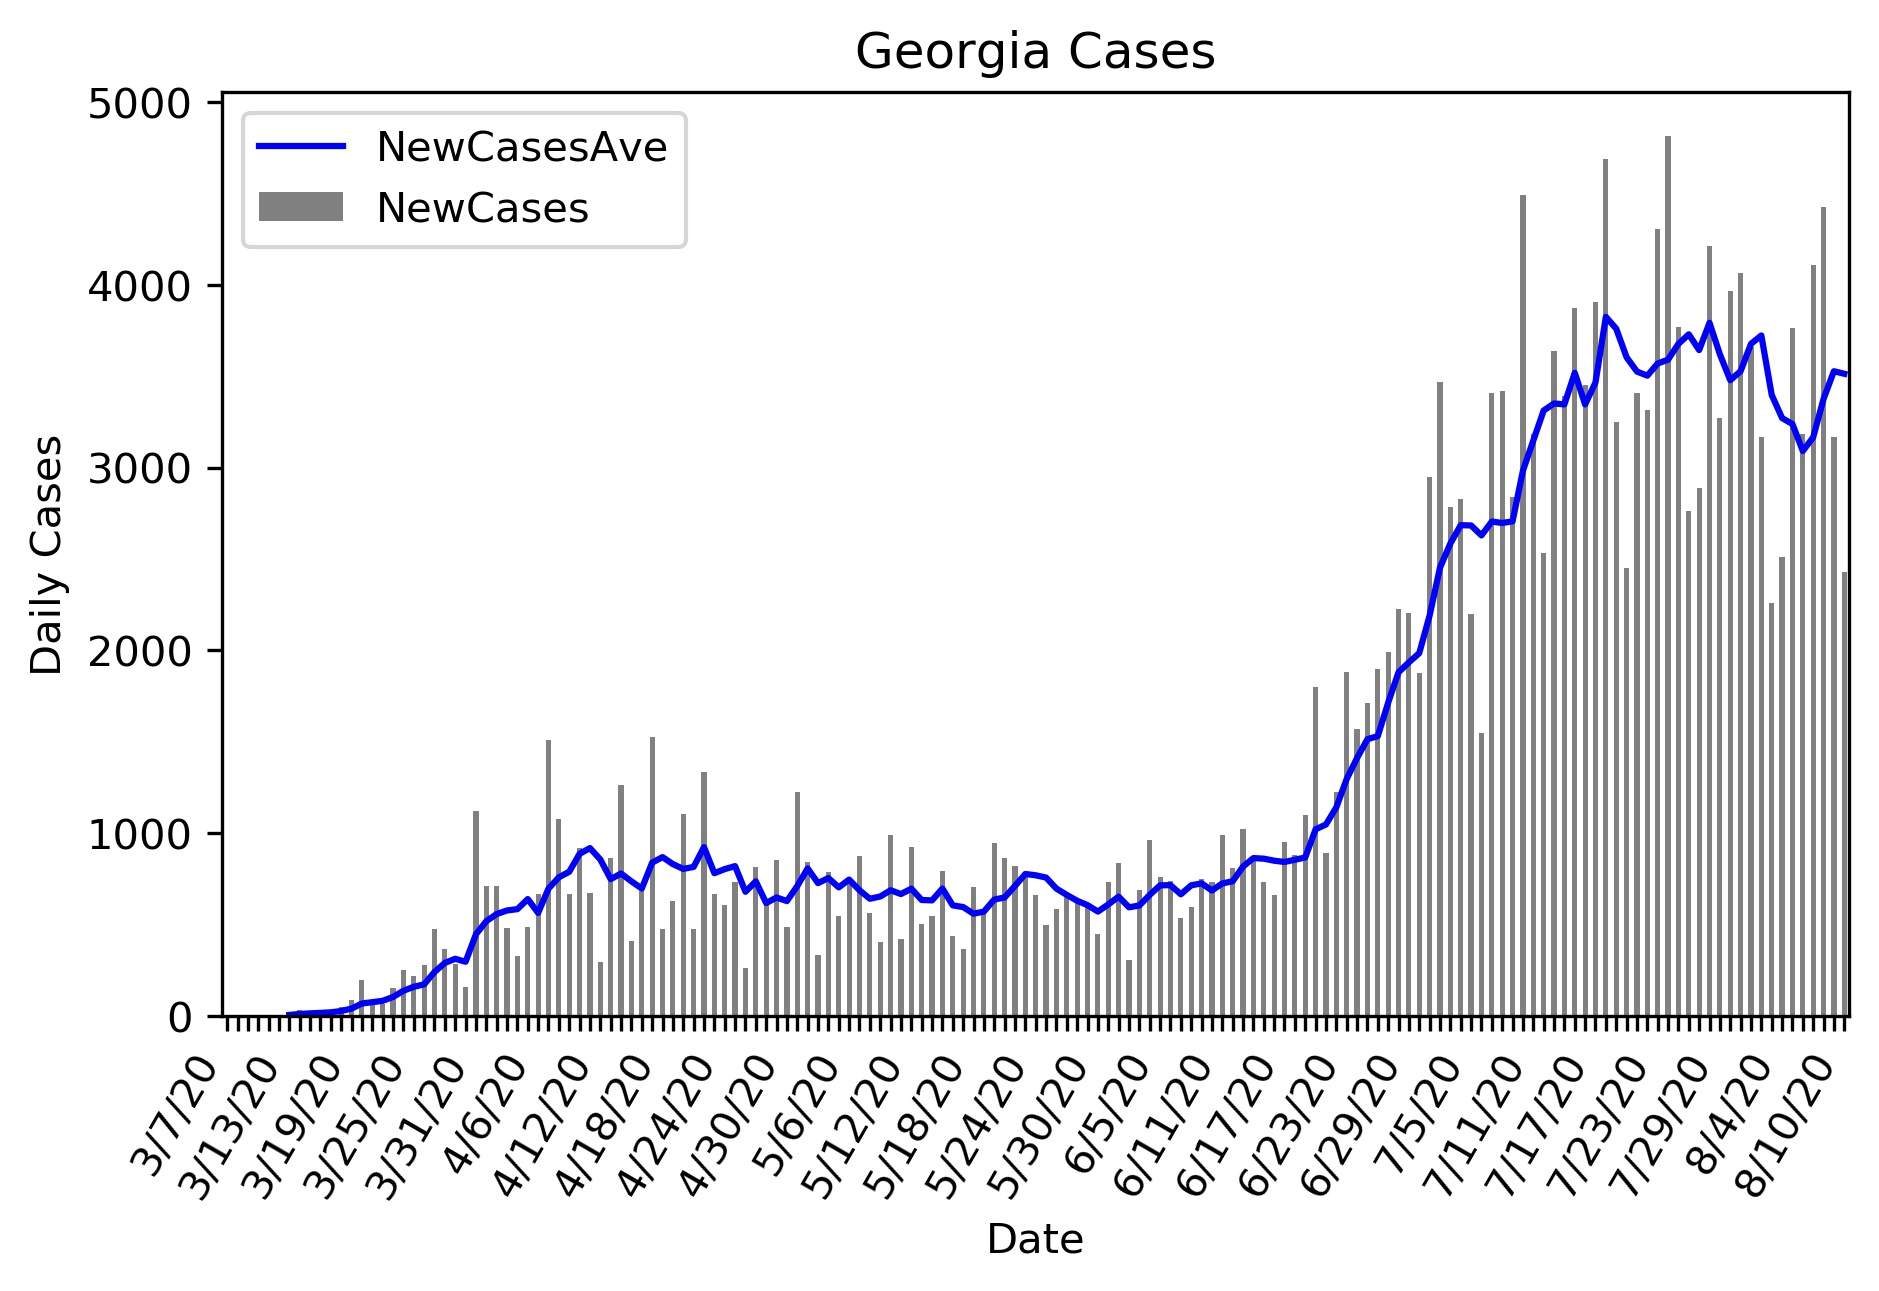
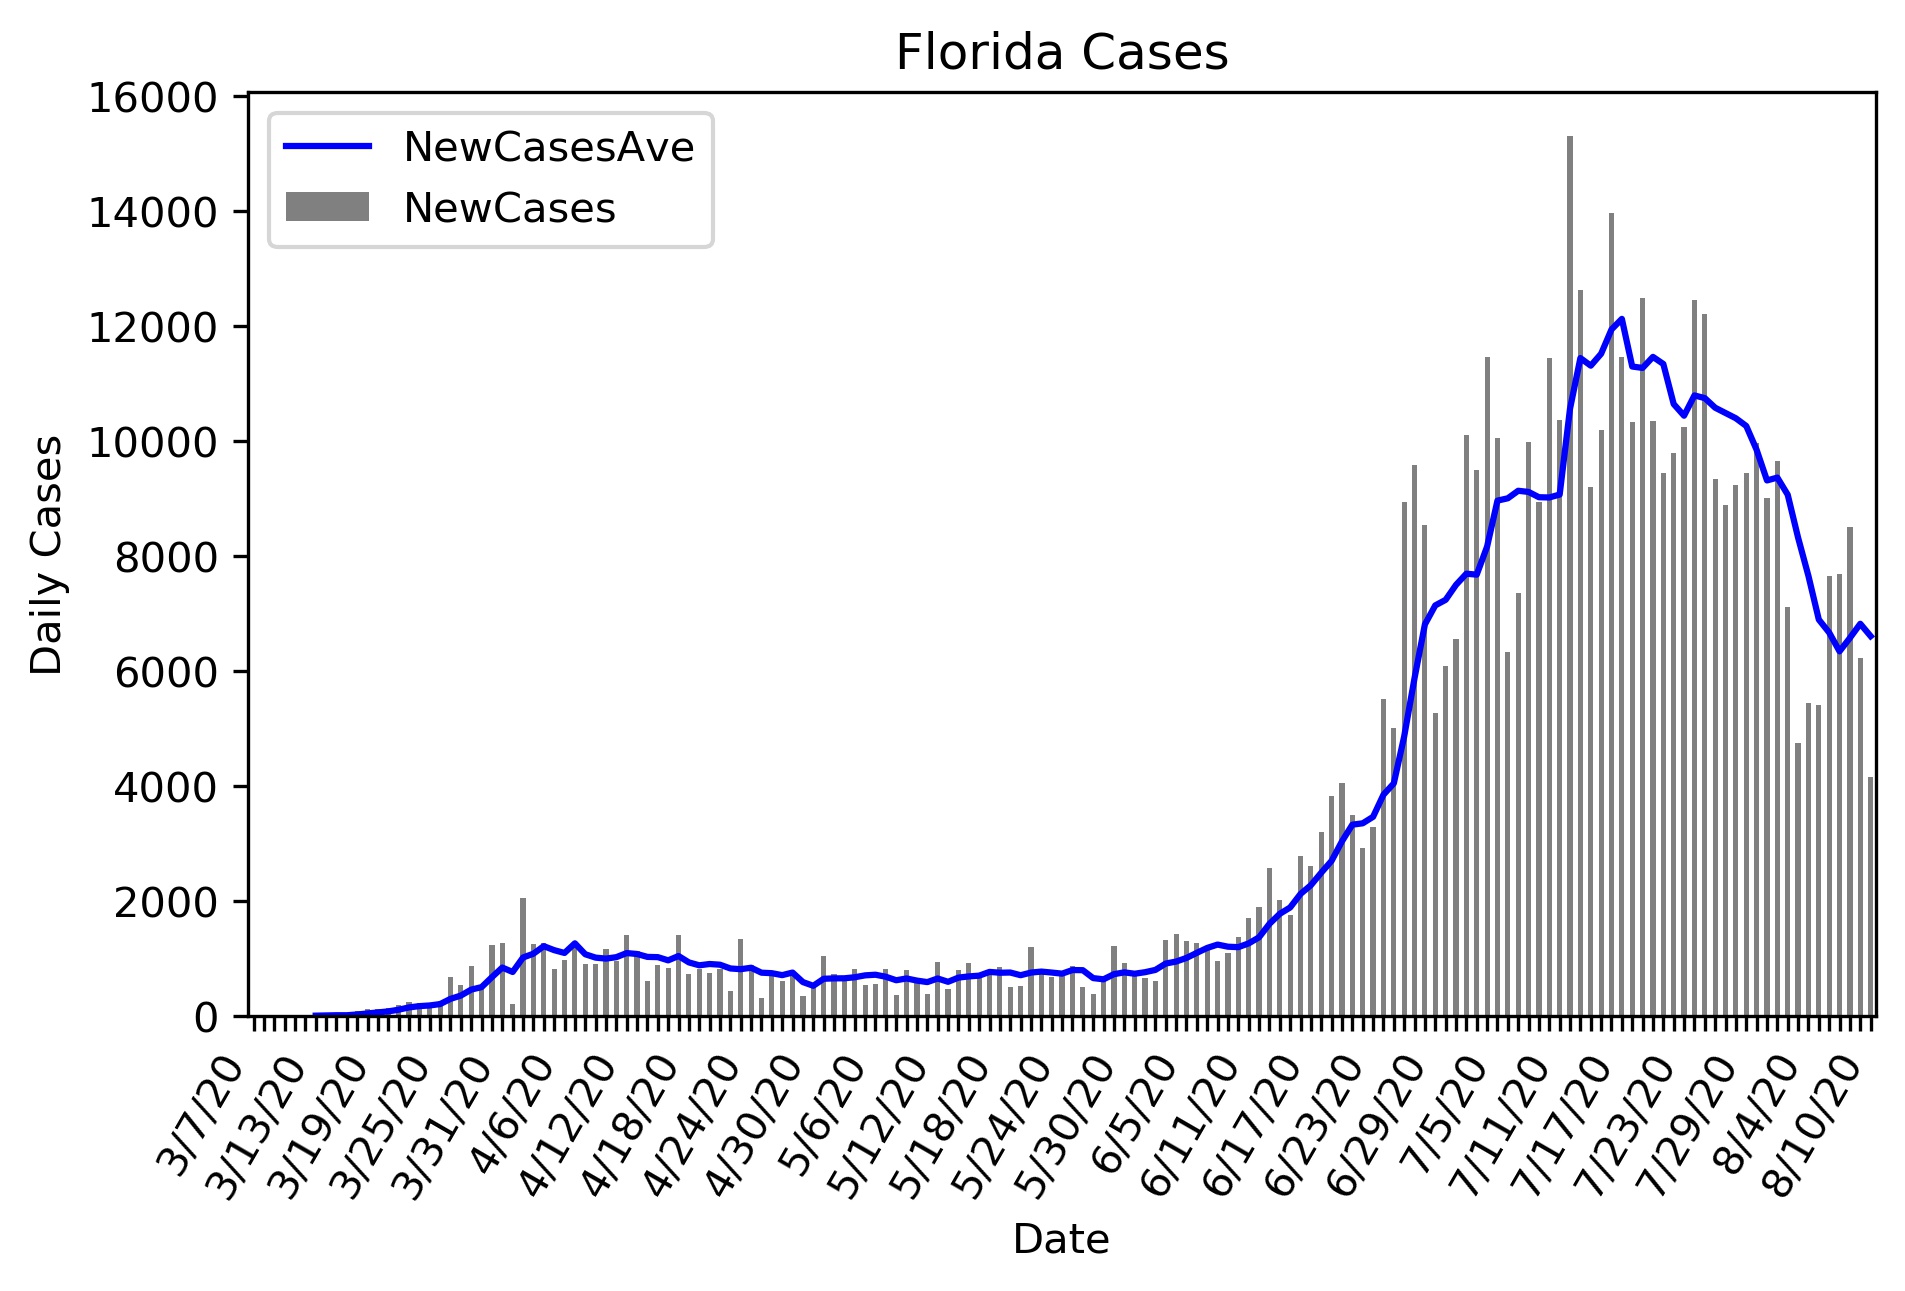
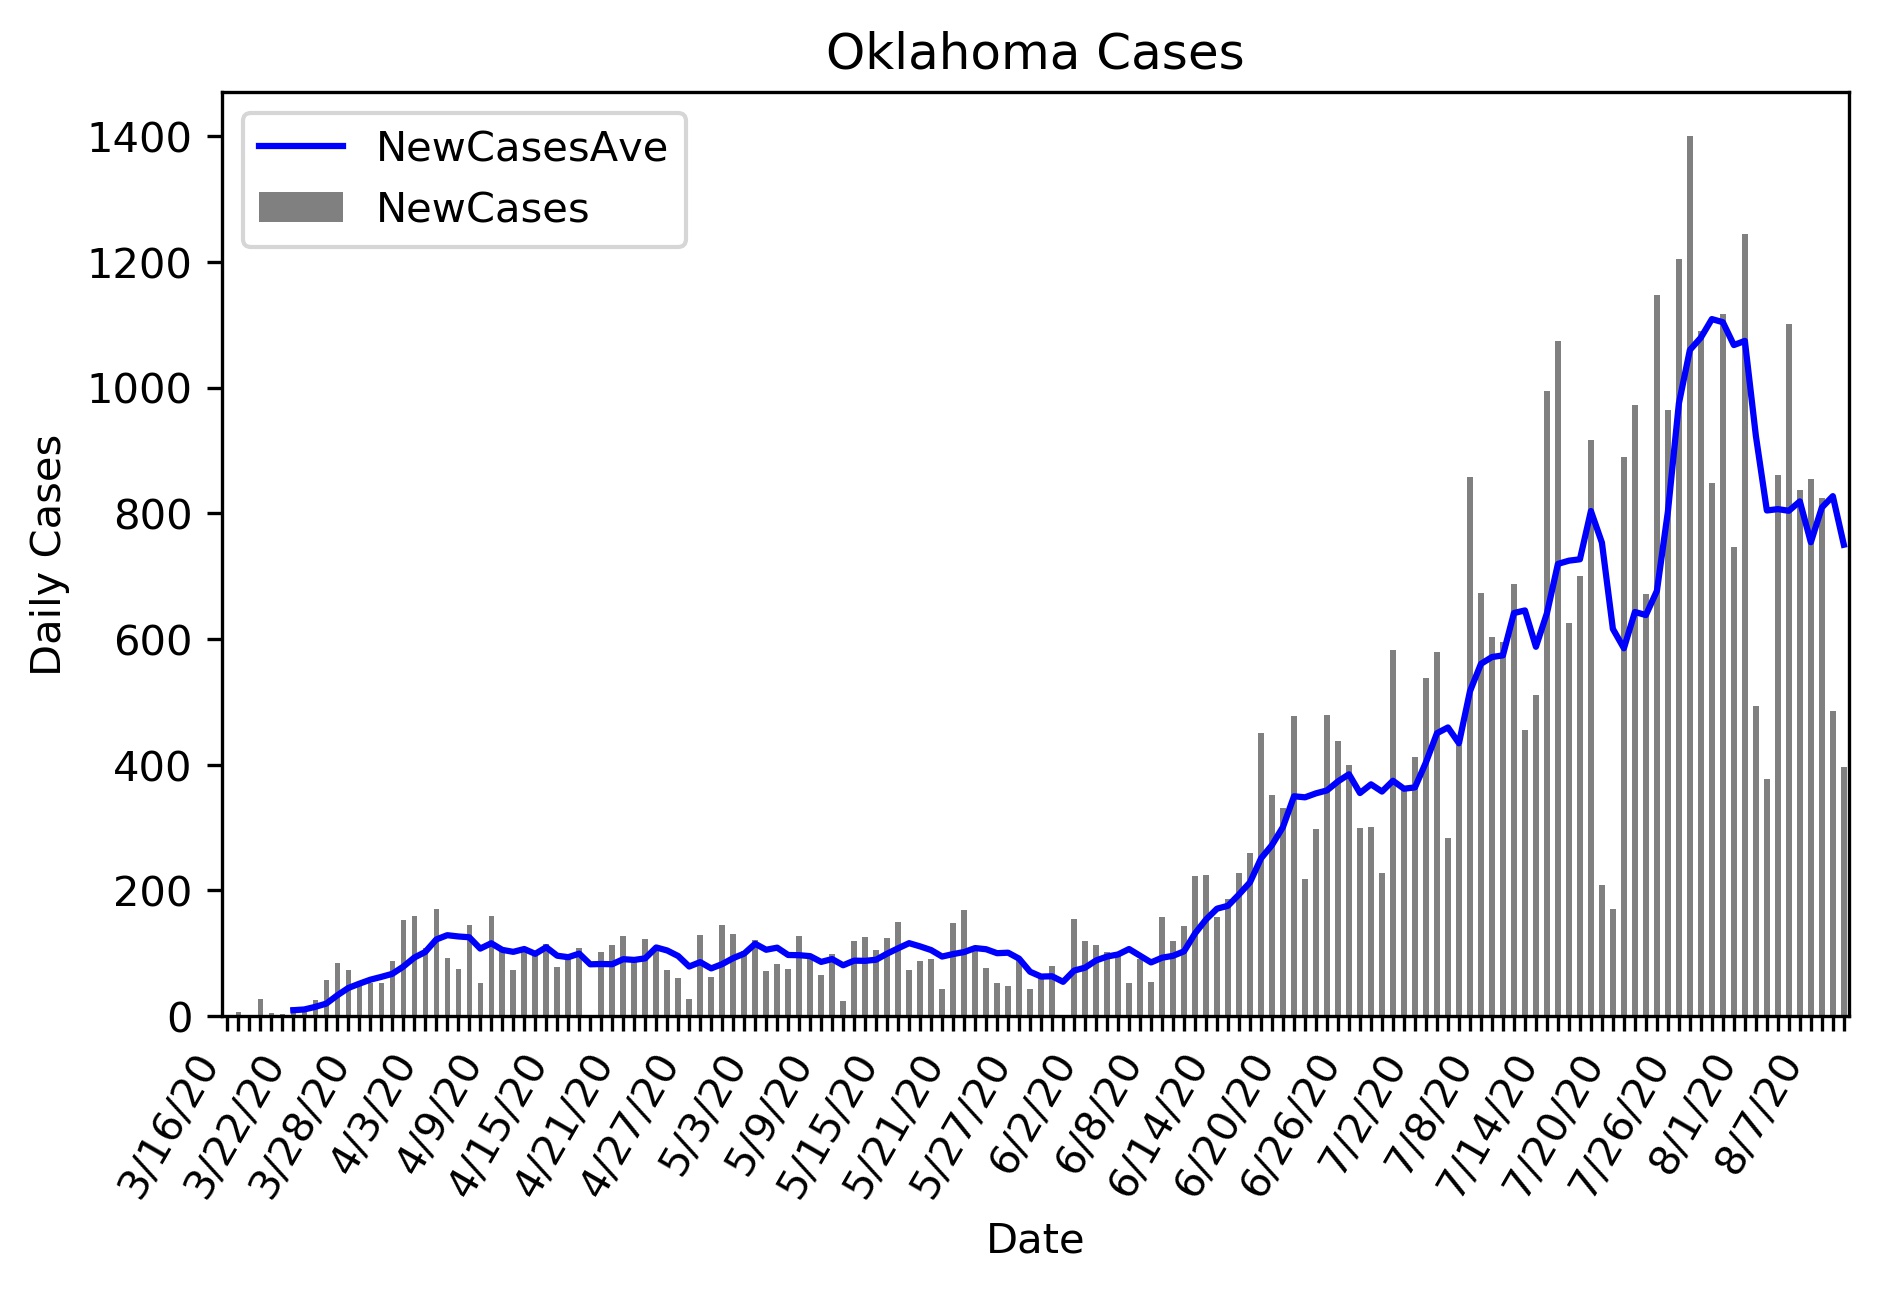
Cases per day. The line is a 5 day running average.
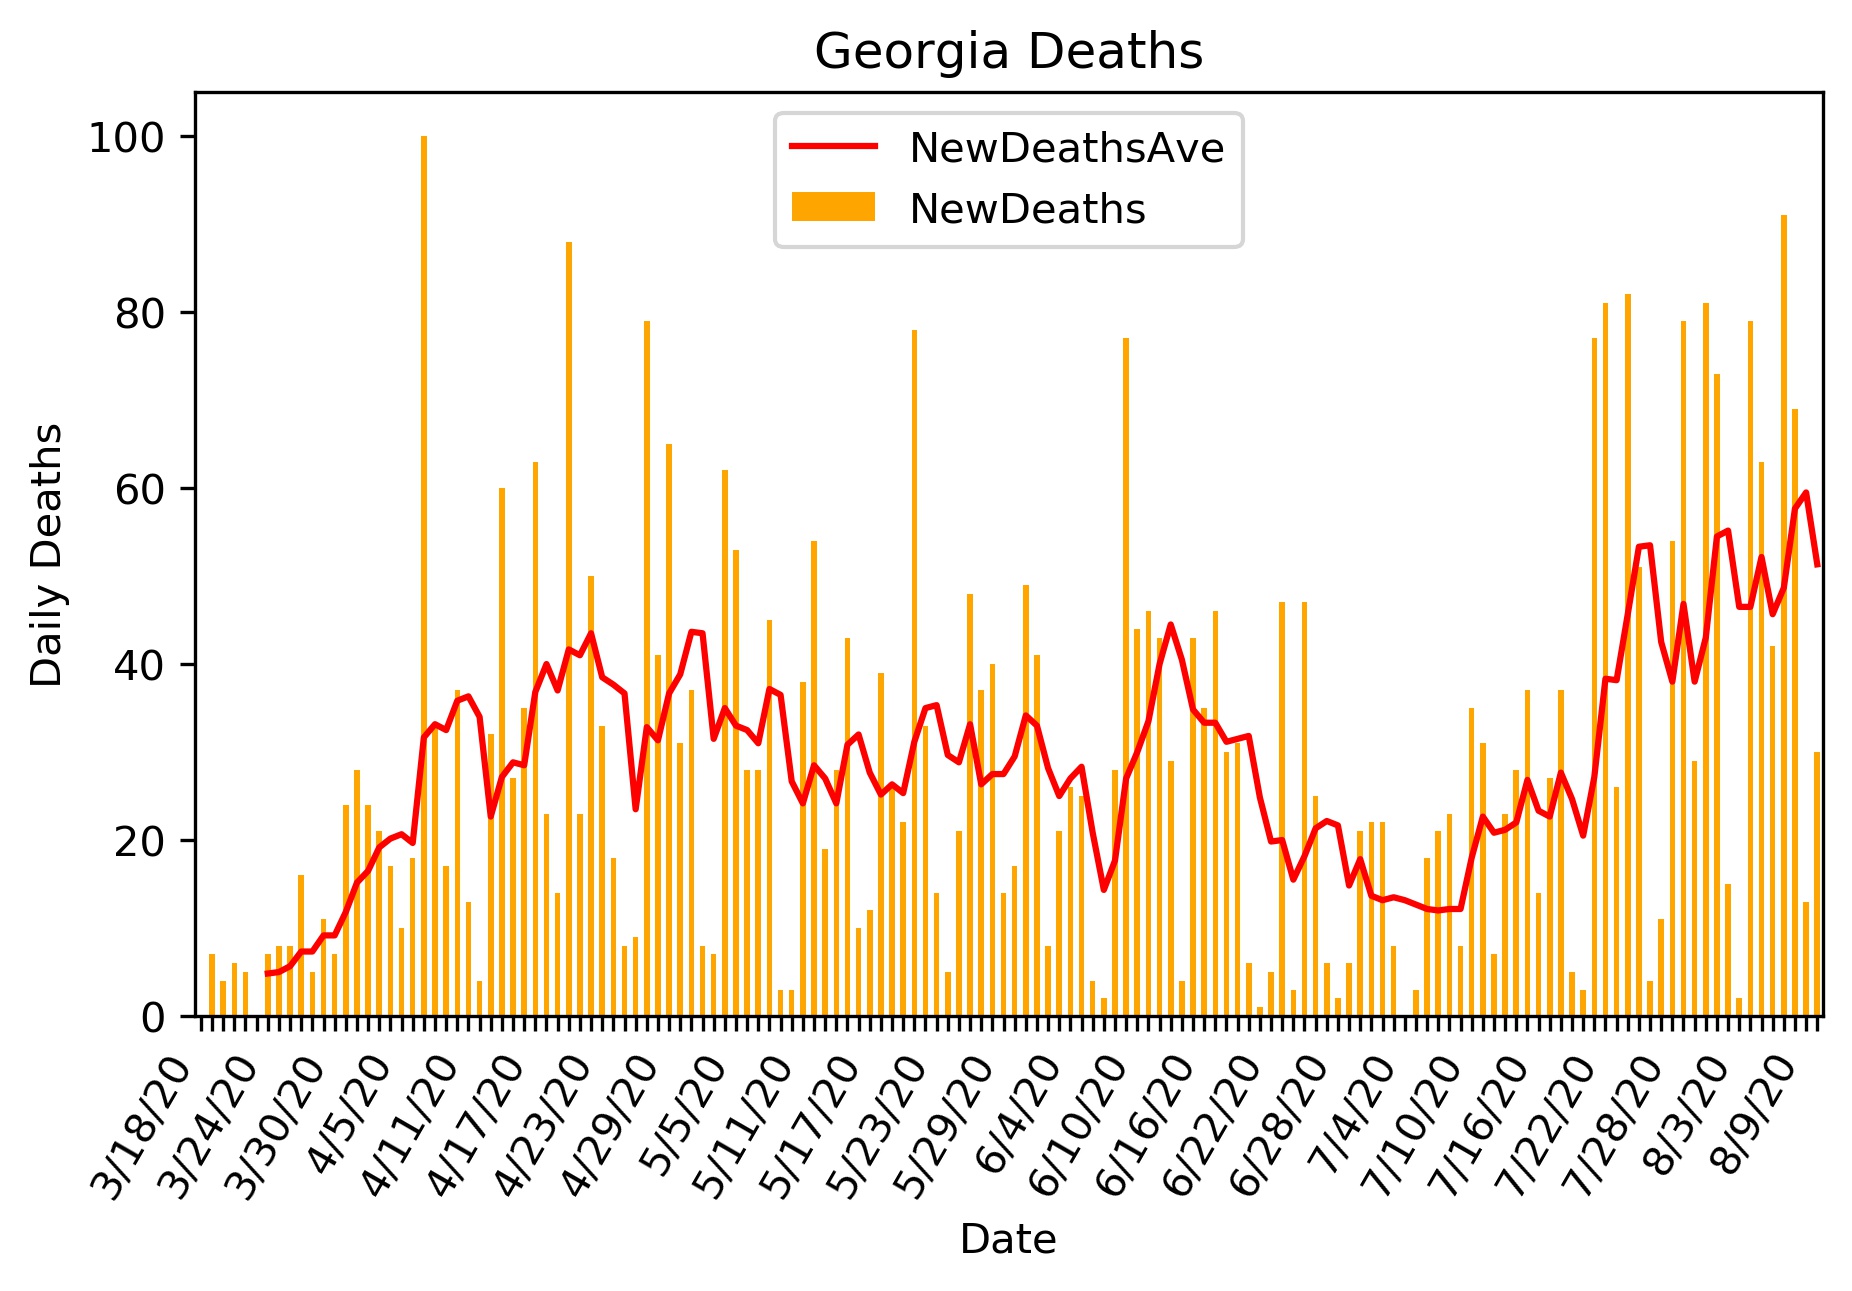
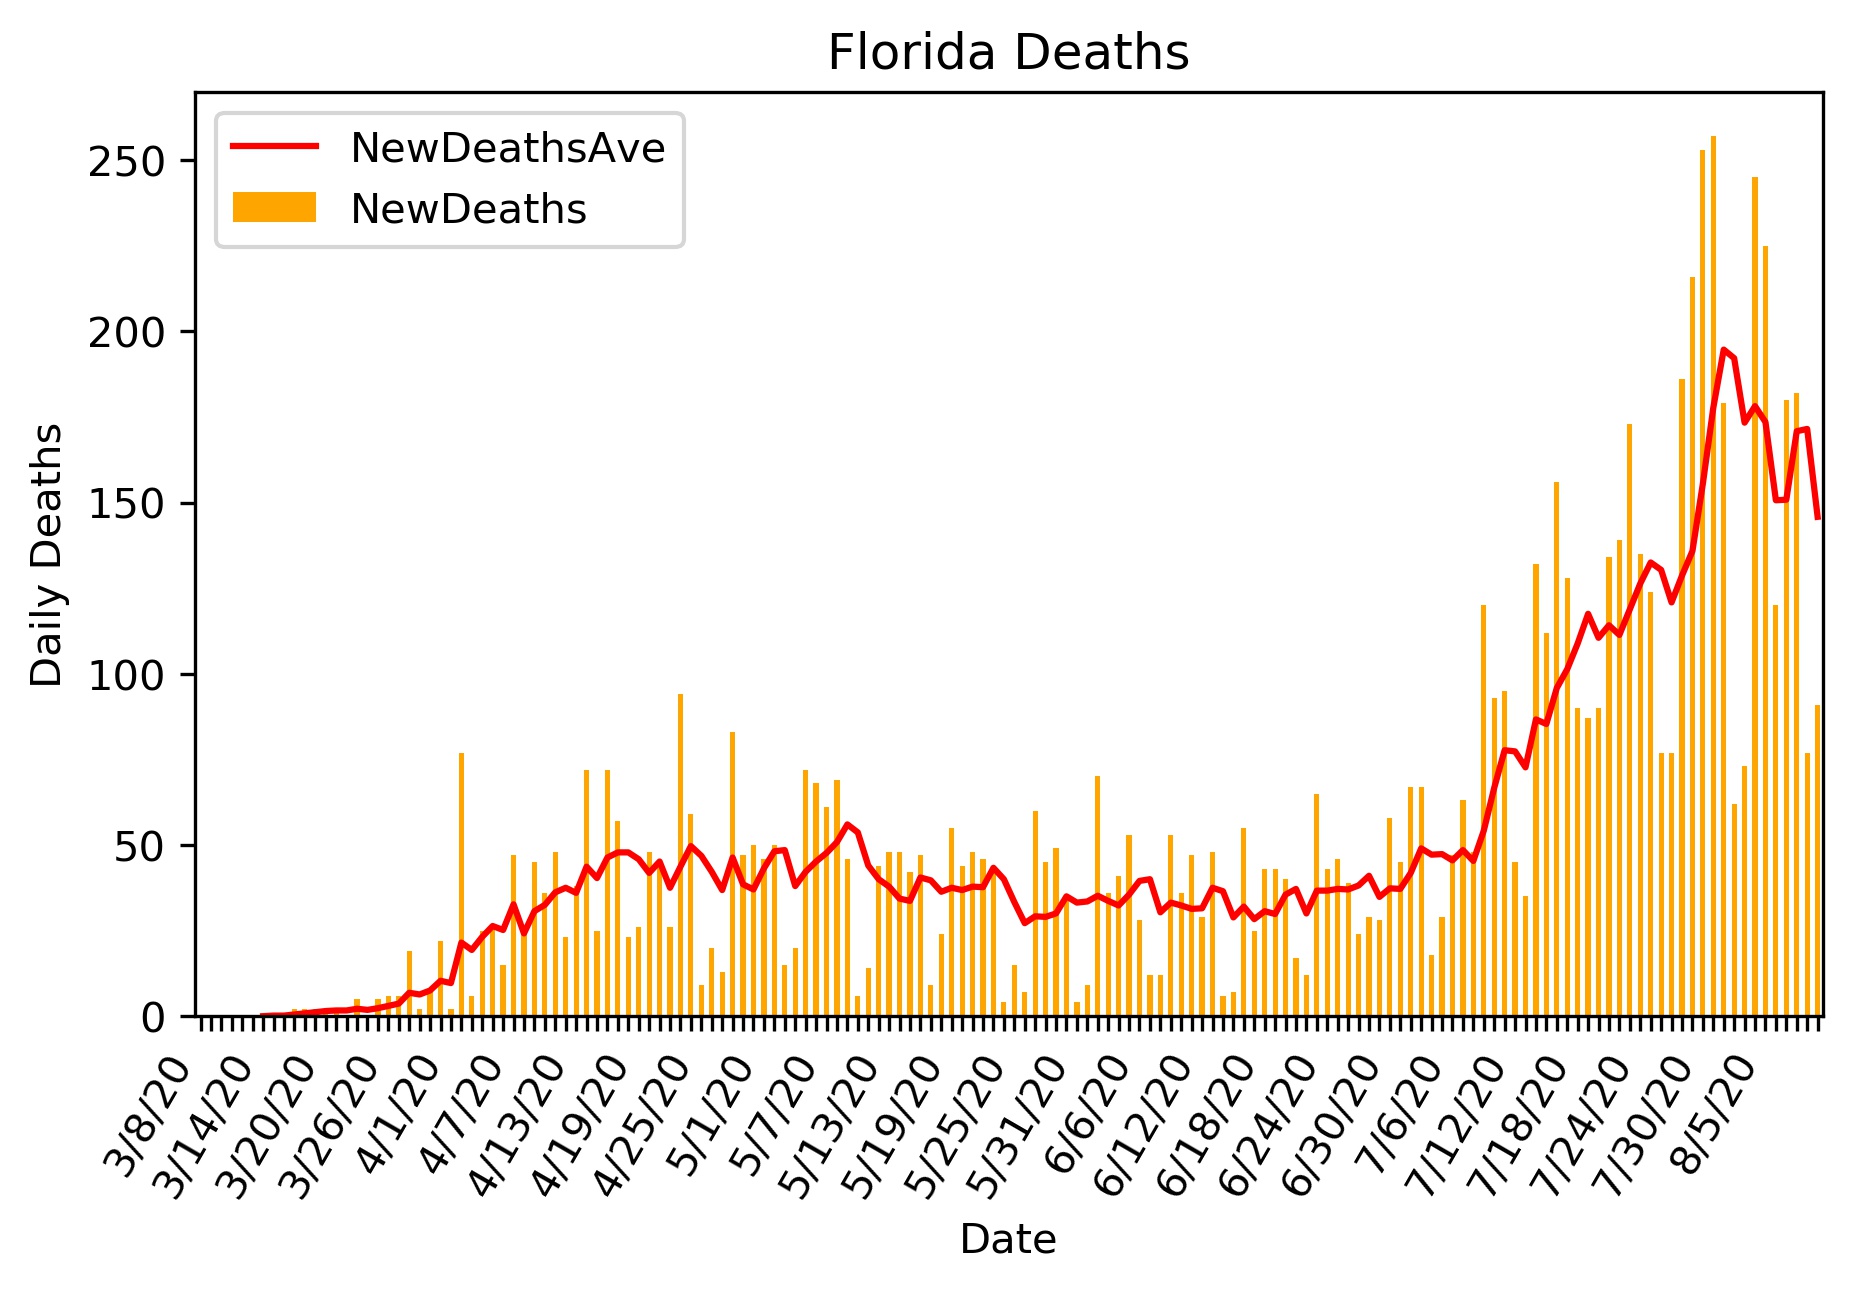
Deaths per day. The line is a 5 day running average. Death Rates. The purple line is Deaths/Cases. The orange line is Deaths/10,000 people. Both of these figures use the 5 day running average data.
Cases per day. The line is a 5 day running average.
Deaths per day. The line is a 5 day running average. Death Rates. The purple line is Deaths/Cases. The orange line is Deaths/10,000 people. Both of these figures use the 5 day running average data.Cases per day. The line is a 5 day running average.
Deaths per day. The line is a 5 day running average. Death Rates. The purple line is Deaths/Cases. The orange line is Deaths/10,000 people. Both of these figures use the 5 day running average data.Cases per day. The line is a 5 day running average.
Deaths per day. The line is a 5 day running average. Death Rates. The purple line is Deaths/Cases. The orange line is Deaths/10,000 people. Both of these figures use the 5 day running average data.